Top-Down vs Bottom-Up Market Sizing: When They Disagree
Top-down vs bottom-up market sizing run on one real market, plus a reconciliation worksheet that names which input broke when the two numbers disagree.

In January 2026, Gartner published a forecast table putting worldwide spending on AI models at $43.4 billion in 2027. Four months later, the same firm published the same table with the same line at $59.2 billion (Gartner, January 2026; Gartner, May 2026). A 36% revision to a single line item in four months, with nobody’s product having changed. Anyone running top-down vs bottom-up market sizing this year had a third of their top-down answer rewritten by a press release.
It gets worse when you compare across research firms. IDC put worldwide AI infrastructure spending at $497 billion for 2026 (IDC, July 2026). Gartner’s May table put a line carrying the same label at $1.43 trillion. Same year, same words, 2.9x apart.
That is the denominator most top-down sizing starts from. Top-down vs bottom-up market sizing is not two routes to one number, and you should stop trying to make them agree. Run honestly, they will disagree. The size of that disagreement is the most useful thing the exercise produces, because the ratio between the two estimates tells you which of your inputs is broken. Every article currently ranking for this topic stops at “use both and compare.” Nobody publishes what to do when comparing them makes the problem worse.
The second thing page 1 gets wrong is the audience. Those articles are written to help you persuade an investor. Most market sizing is done by a product marketer deciding which of three segments gets next quarter’s launch, with a VP asking why. The two methods behave very differently when the answer has to survive an internal argument instead of a pitch meeting.
The short answer
Top-down market sizing starts with a published total for a market and multiplies it by the share you believe you can address. Bottom-up market sizing starts with a count of the accounts you could actually sell to and multiplies that count by a realistic annual contract value. Top-down is fast and fragile, because the entire answer rests on one share assumption. Bottom-up is slower and sturdier, because every input is a number you can defend line by line.
Run both. When they land more than 2x apart, resist the urge to average. Treat the ratio between them as a pointer to one specific broken input, then go fix that input.
| Dimension | Top-down | Bottom-up |
|---|---|---|
| Starting point | A published market total | A count of addressable accounts or units |
| Core formula | Market total x your share | Accounts x annual contract value |
| Weakest input | The share percentage | The account count and the ACV assumption |
| Fails silently when | The published market is defined differently than your product | A buyer segment is missing from the count |
| Naturally produces | TAM | Something between SAM and SOM |
| Best used for | A ceiling check and a market-growth narrative | Segment prioritization, quota setting, launch cases |
| Who it convinces | Investors and boards | Your own CFO and your own sales leader |
What market sizing actually is
Market sizing is the practice of estimating how much revenue exists in a defined market over a defined period. It is an estimate with an explicit method, not a measurement, and the method is the part that matters.
Three things separate it from forecasting:
- Market sizing answers “how big is the pool.” Forecasting answers “how much of it will we catch next year.”
- Market sizing is bounded by definition. The moment you constrain it by your sales headcount, you are forecasting.
- Market sizing is comparative. Its main job is to rank two opportunities against each other, and a ranking survives a lot of absolute error.
That last point is the one operators miss. If segment A sizes at $400 million and segment B at $60 million, you do not need either number to be correct. You need the ratio to be directionally right, and you need to know which inputs would have to break for the ranking to flip. That is a far lower bar than “produce an accurate TAM,” and it is the bar a launch decision actually sets.
A sizing exercise should produce four artifacts:
- The estimate itself.
- The list of assumptions, each tagged as sourced or assumed.
- The single assumption the answer is most sensitive to.
- The value that assumption would have to take for the decision to change.
If your sizing deck has the number but not the other three, you have produced a slide.
The top-down market sizing method, and where the percentage comes from
Top-down sizing has two inputs and one of them is usually invented.
TOP-DOWN
  Published market total          (sourced)
    x  geographic share           (sometimes sourced)
    x  segment share              (rarely sourced)
    x  your addressable share     (almost never sourced)
  = your market size
The published total is the easy part. Gartner, IDC and the industry associations publish numbers, and you can cite them. The multipliers are where the analysis quietly becomes fiction.
Two things go wrong, and the AI market makes both visible:
- The total moves. Gartner’s own 2027 AI spending total went from $3.34 trillion in January 2026 to $3.49 trillion in May. The AI models line inside it moved 36% in the same window. If your sizing multiplies a percentage against a number that moves by a third inside four months, your answer has a shelf life measured in weeks.
- The same words describe different things. IDC’s $497 billion AI infrastructure figure and Gartner’s $1.43 trillion AI infrastructure line are not a disagreement about reality. They are two different scopes wearing the same label. IDC’s tracker counts server and infrastructure spend; Gartner’s line explicitly bundles AI-optimized IaaS, servers, network fabric, processing semiconductors and devices. Neither is wrong. Both are unusable until you read the definition.
A share assumption is defensible only when it is anchored to something published. Ranked from strongest to weakest, the anchors available to you are:
- A regional or segment split published by the same source as the total, in the same report.
- A split published by a different credible source that uses the same market definition.
- A proxy split from a related market, with the difference in economics explicitly stated.
- Your current share of an adjacent market you already sell into.
- A round number that felt reasonable.
If you are on the last line, you have not sized a market. You have multiplied a real number by an opinion, and the output inherits the confidence of the opinion.
The bottom-up market sizing method: accounts times ACV
Bottom-up sizing is arithmetic on units you can name.
BOTTOM-UP
  Total accounts in the universe   (sourced count)
    x  % that fit the ICP          (your qualification rules)
    =  addressable accounts
    x  annual contract value       (your packaging)
  = your market size
The account count comes from somewhere real: government statistics, licensing registries, association membership rolls, a firmographic database, or your own CRM plus a coverage estimate. The ACV comes from your own pricing and packaging, which is why bottom-up sizing is a product marketing job rather than a finance job. Nobody else in the building knows what a realistic blended contract actually looks like across tiers.
The universe count is where most bottom-up estimates break, and the failure is almost always a definition. Take the most cited business statistic in the United States. The SBA Office of Advocacy counts 36,207,130 small businesses. Build a bottom-up TAM on that number and you have inflated your universe by 5.7x, because 82.3% of them, 29,811,495 firms, have no employees at all. Only 6,395,635 are employer firms, and there are 21,041 large businesses in the whole country (SBA Office of Advocacy, February 2026). If your product needs a payroll, a procurement process or a second user, roughly five out of six businesses in your headline number cannot buy it.
The ACV input has its own failure mode: using list price for the cheapest tier as though it were the blended contract. If your packaging has a $19 tier and a $39 tier and most revenue comes from the higher one, sizing on $19 halves your answer. Getting this right is downstream of your pricing strategy, and it is the reason a PMM who owns packaging produces better bottom-up numbers than an analyst who does not.
If your ladder is a three-tier one, the number to multiply by is the blended contract implied by your target revenue mix across Good, Better and Best.
How TAM, SAM and SOM map onto the two methods
TAM, SAM and SOM are not three different calculations. They are three different filters applied to the same market, and the two sizing methods land you at different points on that ladder by default.
| Layer | What it means | Which method naturally produces it |
|---|---|---|
| TAM | Total addressable market: revenue if every possible buyer bought from someone | Top-down, almost always |
| SAM | Serviceable addressable market: the slice your product, pricing, language and geography actually reach | Bottom-up, once ICP filters are applied |
| SOM | Serviceable obtainable market: what you can win in a defined period given capacity and competition | Bottom-up, with a penetration and a time window applied |
This mapping explains a chunk of every gap you will ever see. An unfiltered top-down number is a TAM, a bottom-up number with ICP qualification applied is a SAM, and comparing them means comparing two different questions. That alone accounts for much of any divergence under 2x.
The operating rule: make both methods produce the same layer before you compare them. Strip the ICP filters out of the bottom-up number, or apply equivalent filters to the top-down one. Most reconciliation arguments end right here, which is why the definition check comes first in the worksheet below. Getting those filters right is its own piece of work, and the distinction between an ICP and a buyer persona is where most qualification rules go wrong.
A market sizing example: sizing one market both ways
Here is one market run through both methods, with every sourced input linked. The market: a per-seat AI coding assistant sold to software teams in the United States.
The top-down pass
The Gartner table cited above puts worldwide spending on AI application development platforms at $8,416 million for 2026. Apply a 40% share for the United States, which is the kind of number that appears in sizing decks without a footnote:
$8.416B worldwide AI application development platforms (2026)
  x  40% assumed US share
  = $3.37 billion
The bottom-up pass
The US Bureau of Labor Statistics reports that software developers held about 1.7 million jobs in 2024, and software quality assurance analysts and testers held about 201,700 (BLS Occupational Outlook Handbook). GitHub publishes Copilot list pricing at $19 per granted seat per month for Business and $39 for Enterprise (GitHub Copilot plans), which is $228 and $468 a year. Blend them at the midpoint:
1,700,000 software developers
+   201,700 QA analysts and testers
= 1,901,700 addressable seats
  x  $348 blended annual seat price
  = $662 million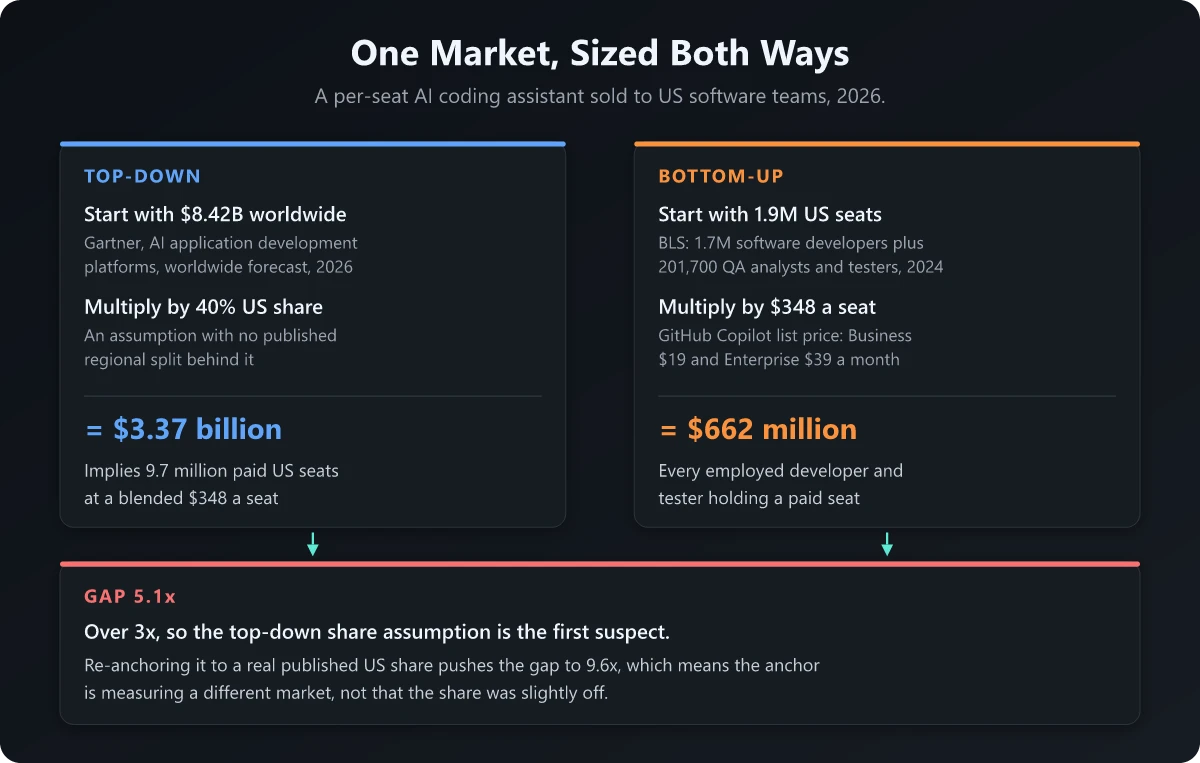
Top-down: $3.37 billion. Bottom-up: $662 million. Gap: 5.1x.
Both numbers are built from real, citable inputs, and both use standard method. They are still five times apart, which means at least one of them describes a market that does not exist. This is where every other article on the topic hands you back to your own judgment.
The market sizing reconciliation worksheet: what to do when top-down and bottom-up market sizing disagree
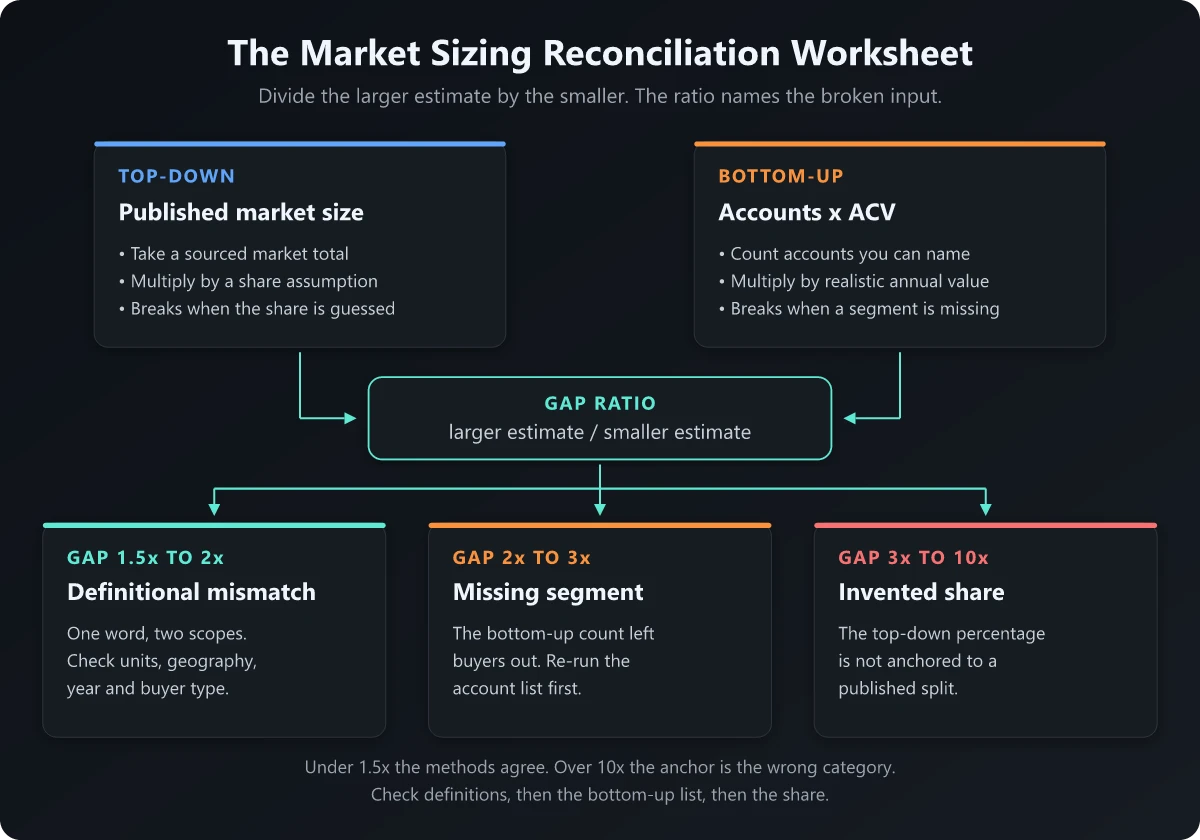
Divide the larger estimate by the smaller. The ratio is a diagnostic, and it points at a specific input.
| Gap ratio | Most likely broken input | What to check | The fix |
|---|---|---|---|
| Under 1.5x | Probably nothing | Whether both methods drew on the same underlying source | Accept the range, but confirm the agreement is not circular |
| 1.5x to 2x | Definition drift | Units, geography, year, currency, buyer type, TAM vs SAM layer | Restate both estimates to identical scope and re-run |
| 2x to 3x | The bottom-up account count | Which buyer segments are absent from the universe | Rebuild the account list with adjacent buyers added |
| 3x to 10x | The top-down share assumption | Where the percentage came from, and whether it is cited | Re-anchor to a published split, or drop the top-down estimate |
| Over 10x | The top-down anchor itself | Whether the published market is the same product category | Discard the top-down number and defend the bottom-up one |
The bands are a heuristic, not a law of arithmetic. The value is in the order of operations, because checking these in the wrong sequence wastes days.
Check in this order:
- Definitions. Same year, same currency, same geography, same buyer, same TAM/SAM/SOM layer. This is the cheapest check to run and the one I would always run first, because it costs twenty minutes.
- The bottom-up universe. List every buyer type your count excluded, and price the ones that belong. Additions here move the number by tens of percent, rarely by multiples.
- The bottom-up ACV. Check blended contract value against list price, and check whether a free tier is absorbing buyers you counted as paying.
- The top-down share. Find the source of the percentage. If there is no source, the number is an opinion and the gap is explained.
- The top-down anchor. Read the category definition in the published report. If it bundles adjacent spend, your comparison was never valid.
Working the example back
Applied to the $3.37 billion versus $662 million disagreement:
- Definitions. Gartner’s AI application development platforms category is not a per-seat coding assistant category. It is platform spend. The top-down anchor was never measuring the same product, so the step 5 problem surfaced during the step 1 check.
- The bottom-up universe. The 1.9 million count excludes contractors, students on free tiers, and non-developer roles that write code. Adding them moves the number by a meaningful percentage. It does not move it 5x.
- The bottom-up ACV. $348 is the midpoint of two published business tiers. GitHub also lists individual plans at $10, $39 and $100 a month and a free tier, so the realistic blend is arguably lower, which widens the gap.
- The top-down share. The 40% has no source. The only published US share I could verify anywhere nearby is IDC’s, at 75.7% of global AI infrastructure spend in Q1 2026 - and that is server and accelerator spend, not software seats.
Substitute the only sourced share available and the top-down estimate rises to $6.37 billion. The gap widens to 9.6x. That is the tell. When correcting an input makes divergence worse, the input was not slightly wrong; it was the wrong input entirely. The anchor is measuring a different market, and the top-down number should be thrown out rather than reconciled.
Two reality tests that catch a broken number in 60 seconds
Before you defend either estimate in a room, run both of these. Each takes under a minute and neither needs data you do not already have.
Test one: what penetration does this number imply? Divide the estimate by ACV and look at the account or seat count that falls out. Then compare it to the real universe.
$3.37 billion  /  $348 per seat  =  9.7 million paid US seats
Actual US base                   =  1.9 million developers and testers
Implied penetration              =  about 5 paid seats per person
A number that requires five paid seats per human being is not a market size. And the bottom-up number needs the same treatment: $662 million assumes every single employed developer and tester in the country holds a paid seat. Stack Overflow’s 2025 survey found 84% of respondents are using or planning to use AI tools, with 47.1% using them daily, 17.7% weekly and 13.7% monthly or infrequently (Stack Overflow Developer Survey 2025). Usage is high, but a free tier exists and 100% paid conversion does not. So $662 million is a TAM ceiling, not a SAM, and the SOM is a fraction of it.
Penetration realism is not confined to software. The SBA figures cited above show only 7.6% of US businesses used AI between September 2024 and August 2025. Any sizing that assumes an emerging category converts a majority of its universe inside a planning cycle is asserting something the adoption data does not support.
Test two: is the share figure anchored to anything? Ask one question of every percentage in the model: who published this, and about what. Then apply the substitution test from the worked example. If replacing your assumed share with a genuinely published one makes the two estimates diverge further, the problem is the anchor and no amount of tuning the percentage will fix it.
How to do market sizing with both methods, step by step
The full procedure, in the order that produces the fewest wasted days:
- Write the market definition in one sentence before touching a number. Product category, buyer, geography, time period. Every later argument traces back to this sentence.
- Build the bottom-up estimate first. It forces you to name the accounts, which surfaces definitional problems while they are still cheap to fix.
- Source the account universe from government statistics, registries or a firmographic database. Record the exact table and date.
- Apply ICP filters explicitly, one line per filter, each with the percentage it removes. This is your audit trail when someone challenges the number.
- Set ACV from your own packaging, blended across tiers by expected mix.
- Build the top-down estimate second, and record the source and definition of both the total and every multiplier.
- Compute the gap ratio and run it through the reconciliation worksheet above.
- Run both reality tests, then state the number as a range with the one assumption the answer is most sensitive to named out loud.
Step 8 is the deliverable. A single number invites a debate about the decimal point; a range with a named sensitivity invites a debate about the assumption, which is the conversation you actually want.
Common market sizing mistakes
The failures that do the most damage, in rough order:
- Averaging the two estimates. The midpoint of a right answer and a wrong answer is a wrong answer with false confidence. Reconcile or discard, never split the difference.
- Counting a universe your product cannot serve. The SBA numbers above are the canonical version: 36 million small businesses, of which only 6.4 million have employees. That is a 5.7x error before you have done any arithmetic.
- Treating convergence as validation. If both methods traced back to the same underlying industry report, agreement proves nothing except that you used one source twice. Test it by asking what independent data each path relied on.
- Using entry-tier list price as ACV. Sizing on the cheapest published number is a habit borrowed from competitive analysis, where it is appropriate, and imported into sizing, where it is not.
- Mistaking a forecast for a measurement. A published market total is a projection with error bars the press release does not print. The 36% revision to one Gartner line in four months, cited at the top of this post, is the honest version of those error bars.
- Sizing revenue instead of sizing a decision. If the answer does not change which segment gets the launch, the exercise was decoration. Decide the decision rule before you start.
- Ignoring the free tier. Product-led categories route a large share of the universe into plans that generate no seat revenue. Count them as users.
Top-down vs bottom-up market sizing: which number you act on
For an internal prioritization call, act on the bottom-up number and use the top-down number as a ceiling check. Three reasons, all of them about the decision rather than the arithmetic:
- You can defend it line by line. When a VP challenges a bottom-up estimate, you point at the account count and the ACV. When they challenge a top-down estimate, you point at a percentage you invented, and the meeting ends badly.
- It ranks segments correctly even when it is wrong in absolute terms. Bottom-up errors tend to be systematic across segments, so the ordering survives. Top-down errors sit in the share assumption, which is set per segment and therefore scrambles the ranking.
- It converts directly into a plan. An account count is a target list. A percentage of a global forecast is not.
Use top-down for the ceiling instead. If your bottom-up SAM exceeds a credible top-down TAM, one of them is wrong and you have caught it before the board did. That check is the entire honest use case for a top-down number in an operating context.
Where each one belongs:
| Decision | Which number | Why |
|---|---|---|
| Which segment gets next quarter’s launch | Bottom-up, per segment | Rankings need consistent method, not accuracy |
| Whether the category is worth entering at all | Top-down, as a ceiling | You need an order of magnitude, not a plan |
| Quota and territory design | Bottom-up | The output has to be a list of named accounts |
| Board or investor narrative | Top-down, with bottom-up as proof | The story needs scale, the credibility needs units |
| Pricing and packaging changes | Bottom-up | ACV is an input you control, so sensitivity matters |
The segment you choose here is the input to everything downstream, from channel selection to launch sequencing. If you are running this early, the sizing work slots directly into a go-to-market strategy as the step that decides who you are building the motion for. And if the bottom-up number for your best segment is smaller than you expected, that is often a product-market fit signal rather than a sizing error, which is a much more useful thing to learn in August than in December.
Top-down vs bottom-up market sizing is a diagnostic
The premise of every page currently ranking for this topic is that one of these methods is better and you should mostly use that one, after comparing. The premise of this post is that comparing them is the entire point, and that the comparison only has value once you know what a specific gap ratio means.
So: run both. Expect them to disagree. Divide the larger by the smaller, take the ratio to the reconciliation worksheet, and check definitions before you touch the account list, and the account list before you touch the share assumption. When correcting an input widens the gap, stop reconciling and discard that estimate. When the number implies more paid seats than there are humans, you have found your error without needing anyone’s permission.
Top-down vs bottom-up market sizing done this way stops being a forecasting ritual and becomes a structured way of finding out which of your beliefs about the market is wrong, before you spend a quarter’s launch budget acting on it. What you hand your VP is then a range, a named sensitivity, and a segment recommendation you can defend line by line, which is the version that survives the meeting.
Frequently Asked Questions
What is bottom-up market size?
Bottom-up market size is the number you get by counting the accounts you could realistically sell to and multiplying that count by a realistic annual contract value. It is built from your own units rather than from a published market total, which makes every input something you can defend line by line.
What are the different types of market sizing?
There are two structural approaches: top-down, which starts from a published market total and applies a share assumption, and bottom-up, which starts from an account or unit count and multiplies by price. Value-theory sizing is sometimes listed as a third, but it is a variant of bottom-up that replaces list price with the economic value the buyer captures.
What is TAM and SAM and SOM?
TAM is the total addressable market, the revenue available if every possible buyer bought from someone. SAM is the serviceable addressable market, the slice your product, pricing and geography actually reach. SOM is the serviceable obtainable market, the slice you can win in a defined period given your capacity.
What are the 4 types of market analysis?
The four analyses most teams run are industry analysis (structure, growth and regulation), market sizing (how big the opportunity is), competitor analysis (who else is being considered) and customer or segment analysis (who buys and why). Market sizing is one input to the set, not a substitute for the other three.
How do you reconcile top-down and bottom-up market sizing when they disagree?
Divide the larger estimate by the smaller and use the ratio as a diagnostic. Under 1.5x the two methods agree. Between 1.5x and 2x usually means they defined the market differently. Between 2x and 3x usually means the bottom-up count excluded a buyer segment. Between 3x and 10x usually means the top-down share assumption was invented rather than sourced. Over 10x means the top-down anchor is the wrong product category.