SaaS Marketing Plan Template: B2B Example With Budget Math
A free SaaS marketing plan template with a CSV download and a worked B2B example that turns an ARR target into MQLs, a budget and a four-quarter calendar.
A B2B SaaS marketing plan template needs eight sections, in this order: revenue goal, ICP and segments, positioning, pipeline math, channel plan, budget, quarterly calendar and KPIs. The worked example below fills in every one of them for a fictional B2B SaaS company, with the arithmetic on the page and every rate labelled as an assumption you replace with your own.
The eight template pages compared further down hand you section headings, outlines, request forms and one open spreadsheet, and none of them works a revenue goal down to a budget on the page itself. I think section 6 decides whether a plan is ready for finance: the bottom-up cost of the MQL target set against a percent-of-ARR anchor, with any gap closed by one named option that has an owner.
What Goes in a SaaS Marketing Plan Template?
- Revenue goal: the new-logo ARR to win.
- ICP and segments: who you sell to, and who you skip.
- Positioning: the claims you can prove.
- Pipeline math: that ARR worked back to MQLs.
- Channel plan: spend and MQLs per channel.
- Budget: a percent-of-ARR anchor against bottom-up cost.
- Quarterly calendar: programs, targets, owners.
- KPIs: five to seven numbers with owners.
Copy the table below into a doc, or download the template as a CSV file, which opens in Google Sheets or Excel. The CSV has an empty column for your plan and a filled column for the example further down, and the download needs no form or email address.
| # | Section | What to write | Owner | Due |
|---|---|---|---|---|
| 1 | Revenue goal | Starting and target ARR, assumed churn and expansion, and the new-logo ARR left for marketing and sales to win | CEO and CFO set it; the marketing lead restates it | Planning week 1 |
| 2 | ICP and segments | The company profile you sell to, segments ranked by priority, the trigger that starts a buying search, and what is out of scope this year | Product marketing | Week 2 |
| 3 | Positioning | The category you compete in, the alternative buyers compare you with, and the claims you can prove with a customer or a number | Product marketing | Week 2 |
| 4 | Pipeline math | New-logo ARR divided by average contract value and win rate, multiplied by marketing’s sourced share of opportunities, then divided by the SQL-to-opportunity and MQL-to-SQL rates, with each rate marked trailing or assumed | Marketing ops with sales ops | Week 3 |
| 5 | Channel plan | For each channel: spend, expected cost per MQL, MQL target and one owner | Demand generation | Week 4 |
| 6 | Budget | A top-down anchor as a percent of ARR, the bottom-up cost of the MQL target, people versus programs, and how the gap closes | Marketing lead with finance | Week 4 |
| 7 | Quarterly calendar | For each quarter: the main programs and launches, MQL and spend targets, an owner and a review date | Marketing lead | Week 5 |
| 8 | KPIs | Five to seven numbers, each with a definition, a target, an owner and a review cadence | Marketing ops | Week 6 |
Due dates are counted in planning weeks. For a fiscal year that starts in January, a week 1 in mid-October puts the signed plan in the second half of November.
The plan sits underneath the strategy. The SaaS go-to-market strategy decides the segment, positioning and sales motion; this template prices those decisions and puts them on a calendar. If sections 2 and 3 are still blank, the free GTM one-pager builder captures ICP, positioning, pricing, channels, goals and metrics with no signup.
SaaS Marketing Budget: SaaS Capital’s 2026 Medians
The median private B2B SaaS company spends 8% of ARR on marketing and 15% on sales, according to SaaS Capital’s 2026 spending benchmarks, a survey of more than 1,000 companies published on 10 June 2026. Treat the 8% as a cross-check on a budget built bottom-up.
| SaaS Capital 2026, median spend as a share of ARR | All companies |
|---|---|
| Marketing | 8%, unchanged on the year |
| Sales | 15%, up from 13% |
| Customer support and success | 9%, up from 8% |
| Research and development | 22%, unchanged |
| General and administrative | 15%, up from 14% |
| Total across all departments | No all-company total; 96% for bootstrapped companies, 101% for equity-backed |
The 8% is the all-company figure. The same page charts the marketing median by funding source and by company size:
| Group, read from SaaS Capital’s 2026 charts | Marketing median, share of ARR |
|---|---|
| Bootstrapped companies | 5% |
| Equity-backed companies | 10% |
| Under $1M, and $1M-$3M of ARR | 5% |
| $3M-$5M of ARR | 10% in the chart; the text list under the chart says 8% |
| $5M-$10M, and $10M-$20M of ARR | 10% |
| Over $20M of ARR | About 9% |
How to read those numbers for a plan:
- The survey asks what share of revenue is currently spent, so this template applies the percentage to the ARR a company enters the year with. At $8.0M of starting ARR, as in the example below, the medians come to $640,000 for marketing and $1.2M for sales.
- For a company in the $3M-$5M band, use 8% to 10% of ARR as the marketing anchor, since the text and the chart give one figure each.
- The page does not say whether the marketing figure includes salaries. Decide which way you count it before you compare; in the example below, people and tools sit inside the 8%.
- Funding moves the anchor. The text says equity-backed companies spend 100% more on marketing than bootstrapped ones, which matches the 10% and 5% bars, and that companies that raised venture capital grow at a median 25% a year against 20% for bootstrapped companies.
- SaaS Capital surveys in the first quarter of each year, and this edition was completed in March 2026. Check for a newer one before you sign off a 2028 plan.
When a bottom-up budget lands well away from 8%, write the reason into the plan: funding, a new segment, a launch year or a channel with a long payback.
SaaS Marketing Plan Example: A Fictional B2B Company
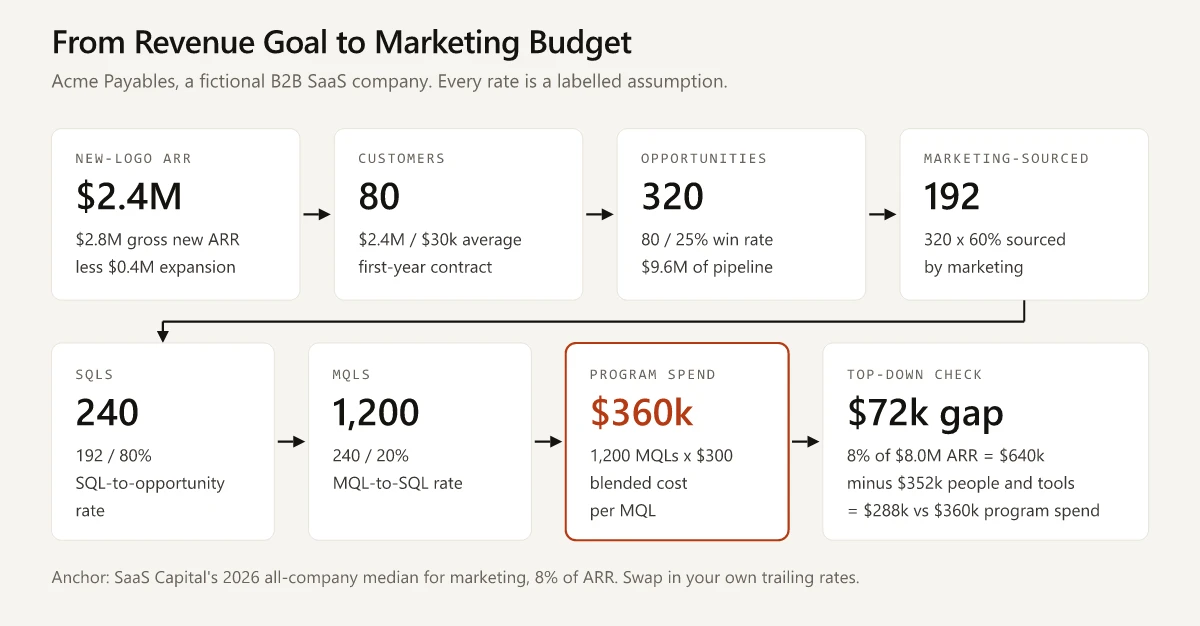
Acme Payables is invented for this post: a venture-backed maker of accounts-payable automation software for finance teams at mid-market companies, entering 2027 at $8.0M of ARR. Each number below is either arithmetic on the lines above it or an assumption labelled as one, so replacing an assumption with your own trailing figure carries through the rest of the plan.
Section 1: Revenue Goal
| Line | Value | Basis |
|---|---|---|
| Starting ARR, 1 January 2027 | $8.0M | Fictional |
| Growth target | 25% | Assumption: SaaS Capital’s median for companies that raised venture capital, quoted in the budget section |
| Target ARR, 31 December 2027 | $10.0M | $8.0M x 1.25 |
| Net new ARR | $2.0M | $10.0M - $8.0M |
| Churned ARR to replace | $0.8M | Assumption: 10% of starting ARR |
| Gross new ARR needed | $2.8M | $2.0M + $0.8M |
| Expansion ARR, owned by customer success | $0.4M | Assumption: 5% of starting ARR |
| New-logo ARR for marketing and sales | $2.4M | $2.8M - $0.4M |
Starting from the $2.0M net figure would leave the plan $0.4M short, which is the churn to replace minus the expansion customer success brings in. Together the two assumptions put net revenue retention at 95%. If yours runs above 100%, as SaaS Capital’s median for bootstrapped companies with $3M to $20M of ARR does in these net revenue retention benchmarks, expansion covers churn and the new-logo target falls below net new ARR.
Sections 2 and 3: ICP, Segments and Positioning
- ICP: US companies with 200 to 2,000 employees, a finance team of five or more and an ERP already running.
- Priority segment: companies in the 90 days after an ERP migration, when approval workflows get rebuilt anyway.
- Out of scope for 2027: companies under 200 employees, where the contract value does not cover the cost of a sales cycle.
- Positioning: invoice approval that runs inside the ERP the finance team already uses, measured against approval by email and spreadsheet.
- Proof: three claims, each backed by a named customer story or a product metric.
Section 4: Pipeline Math, Worked Back to MQLs
The SaaS win rate benchmark post works this division from a new-ARR target to deals and opportunities, and shows how far one wrong win rate moves the result. A marketing plan carries the same division two stages further, to SQLs and MQLs, the units a marketing budget buys.
| Step | Calculation | Result | Basis |
|---|---|---|---|
| New customers | $2.4M / $30,000 average first-year contract | 80 | Assumption: trailing contract value |
| Opportunities | 80 / 25% win rate | 320 | Assumption: trailing win rate |
| Pipeline | 320 x $30,000 | $9.6M, or 4x coverage | Arithmetic |
| Marketing-sourced opportunities | 320 x 60% | 192 | Assumption: marketing’s sourced share |
| SQLs | 192 / 80% SQL-to-opportunity rate | 240 | Assumption |
| MQLs | 240 / 20% MQL-to-SQL rate | 1,200 | Assumption |
The same divisions are laid out line by line in a pipeline math worksheet CSV, with a column for your own numbers next to the example’s.
- The 60% counts opportunities marketing sourced by first touch. The other 128 come from outbound and partner referrals and belong in the sales plan; SaaS demand generation sets out the difference between sourced and influenced pipeline.
- The 20% deserves the hardest look. Published MQL-to-SQL conversion benchmarks swing with the denominator behind them; use your own trailing cohort.
- One blended win rate keeps the table short. If marketing-sourced deals close at a different rate from sales-sourced ones (the win rate post lists published rates by opportunity source), run the marketing rows at marketing’s own rate.
Section 5: Channel Plan
| Channel | Program spend (assumed split) | Assumed cost per MQL | MQLs | Owner |
|---|---|---|---|---|
| Paid search | $100,000 | $250 | 400 | Demand gen |
| Content and SEO | $60,000 | $200 | 300 | Content lead |
| Webinars and events | $90,000 | $450 | 200 | Field marketing |
| LinkedIn ads to a target-account list | $70,000 | $500 | 140 | Demand gen |
| Partner co-marketing | $40,000 | $250 | 160 | Partner marketing |
| Total | $360,000 | $300 blended | 1,200 | Marketing lead |
Take each cost per MQL from your own trailing twelve months by channel. A channel with no history gets a one-quarter test budget, and its full-year line waits for the result.
Section 6: Budget, Top-Down Against Bottom-Up
| Line | Calculation | Amount |
|---|---|---|
| Top-down anchor | 8% x $8.0M starting ARR | $640,000 |
| People and tools | Assumption: 55% of the anchor | $352,000 |
| Program spend inside the anchor | $640,000 - $352,000 | $288,000 |
| Bottom-up program spend | 1,200 MQLs x $300 | $360,000 |
| Gap | $360,000 - $288,000 | $72,000 |
Each way of closing the gap changes a different line of the plan:
- Fund the gap, which takes total marketing spend to $712,000, or 8.9% of starting ARR.
- Raise the MQL-to-SQL rate to 25%, which cuts the MQL target to 960, or $288,000 at $300 each. That needs a named change agreed with sales, one that targets conversion without changing who counts as an MQL (SDR follow-up on every MQL within one business day, for example), before it goes into the plan. A tighter MQL definition would raise the cost per MQL along with the rate.
- Lower the blended cost per MQL to $240, which buys 1,200 MQLs for $288,000 and means moving money toward the section 5 channels that come in under $300.
Acme funds the gap because it is venture-backed, and the marketing lead owns that decision with finance. In SaaS Capital’s charts, both groups Acme belongs to, equity-backed companies and companies with $5M to $10M of ARR, sit at a 10% marketing median, so 8.9% is still below its peers’ median. Whichever option you pick, name its owner, so the first quarterly review can check whether it held.
Section 7: Quarterly Calendar
| Quarter | Main programs | MQL target | Program spend | Owner |
|---|---|---|---|---|
| Q1 2027 | Paid search ramp; webinar series on ERP migrations | 330 | $99,000 | Demand gen |
| Q2 2027 | Customer stories; co-marketing with two ERP partners | 300 | $90,000 | Product marketing |
| Q3 2027 | Content and SEO push; no events | 240 | $72,000 | Content lead |
| Q4 2027 | Events; a campaign timed to buyers’ budget season | 330 | $99,000 | Field marketing |
| Total | 1,200 | $360,000 | Marketing lead |
The 330 / 300 / 240 / 330 split is an assumption: Q3 runs without events, and Q1 and Q4 carry the webinar series and the budget-season campaign. Each quarter’s spend is its MQL target at the blended $300, which holds only if that quarter’s channel mix blends to $300, so check each quarter against the section 5 costs before finance signs.
- Shift the calendar by your sales cycle. With an assumed 90-day lag from MQL to signed contract, Acme’s Q1 2027 bookings come from MQLs created in Q4 2026, and most Q4 2027 MQLs close in 2028. The plan assumes Q4 2026 produced about as many MQLs as Q4 2027 will, so the year’s 1,200 MQLs still map to the year’s 48 marketing-sourced customers, part of the 80; check that against last year’s actual Q4.
- Review MQL pace weekly against the quarter’s target. If a quarter closes below 90% of its target, the next quarter’s spend moves toward the channel with the lowest trailing cost per opportunity.
Section 8: KPIs and Owners
| KPI | 2027 target | Owner | Review |
|---|---|---|---|
| Marketing-sourced pipeline | $5.76M (192 x $30,000) | Marketing ops | Monthly |
| MQLs | 1,200 (330 / 300 / 240 / 330 by quarter) | Demand gen | Weekly |
| MQL-to-SQL rate, by cohort | 20% | Marketing ops with the SDR lead | Monthly |
| SQL-to-opportunity rate | 80% | Sales ops | Monthly |
| Blended cost per MQL | $300 | Demand gen | Monthly |
| Program spend per marketing-sourced customer | $7,500 ($360,000 / 48) | Marketing lead | Quarterly |
| Marketing spend as a share of starting ARR | 8.9% | Marketing lead with finance | Quarterly |
The 48 is 192 marketing-sourced opportunities at the 25% win rate. KPIs say whether the plan is on pace; product marketing OKRs are where a team commits to moving one of them, such as the MQL-to-SQL rate, inside a quarter.
Eight Other Marketing Plan Template Pages, Checked on 16 October 2026
The table covers Google’s US first page for this search in Semrush’s 16 October 2026 snapshot, minus a Reddit thread and a roundup of collateral templates, numbered by position; I read each page logged out that day, and each cell describes what it showed.
| # | Page | Date shown | What you get | Budget figure | Revenue worked back to leads | Calendar |
|---|---|---|---|---|---|---|
| 1 | T2D3 | Updated 25 Jul 2025 | A list of building blocks, three component templates, and links to the T2D3 playbook and book | None | Not on this page | None |
| 2 | Cognism | Updated 12 Oct 2026 | A GTM strategy article whose template banner linked to a page that returned a 404 | None | None | None |
| 4 | Algocentric Digital | 24 Jun 2022 | A section-by-section outline, no download | None | None | Quarterly initiatives asked for, not filled in |
| 5 | SimpleStrat | No date shown | A request form; the page says the template includes worksheets | Not shown | Not shown; the offer mentions the SaaS funnel | Named in the offer, not shown |
| 6 | HubSpot | Updated 29 Jul 2026 | A seven-step article and a general marketing plan template behind a form | Step 5 gives no figure | None | None |
| 8 | Cascade | No date shown | An open Google Sheet of focus areas, objectives, actions and KPIs, with owner, start date and deadline columns | None | None | One start date and deadline per row, no quarters |
| 9 | Kalungi | 5 Dec 2024 | An article about a playbook “exclusive to Kalungi clients” | None | None | None |
| 10 | Saffron Edge | Updated 3 Sep 2025 | An article with no template file | A “Set Your Budget” step with no figure | None | None |
T2D3 does publish the revenue-to-lead arithmetic and a per-channel acquisition check, on a separate post dated 11 October 2026 that works $1.2M of new ARR back to 600 qualified leads and a $300,000 channel split. Cascade’s SaaS marketing strategy template, a Google Sheet, opens without a form. None of the eight puts a percent-of-ARR budget anchor or a four-quarter calendar on the page, and those are the two pieces this template adds next to the worked example.
Filling In Your SaaS Marketing Plan Template for 2027
Before anyone signs, check that section 6 closes: Acme’s $72,000 gap is funded, which takes marketing to 8.9% of starting ARR, and the plan names who owns that decision. Then check each channel line the way T2D3’s budget post does: paid search’s $100,000 buys 400 MQLs at $250 each, which at Acme’s rates is 80 SQLs, 64 opportunities and 16 customers, or $480,000 of the $2.4M of new-logo ARR. A channel line that cannot be traced that way comes out of the plan unless its owner justifies it in a sentence beside the line.
Agree section 1 with finance first, then run section 4 of your SaaS marketing plan template on your own trailing rates.
Frequently Asked Questions
What should a SaaS marketing plan include?
Eight sections: a revenue goal, ICP and segments, positioning, pipeline math, a channel plan, a budget, a quarterly calendar and KPIs. Each section needs a named owner and a due date, and the pipeline math is the part that connects the revenue goal to the budget.
How much should a SaaS company spend on marketing?
SaaS Capital's 2026 survey of more than 1,000 private B2B SaaS companies puts the median at 8% of ARR on marketing and 15% on sales. Use the 8% to cross-check a budget built from your own pipeline math, and read the funding split as well: equity-backed companies spend 100% more on marketing than bootstrapped ones.
How do you build a B2B SaaS marketing budget?
Work the new-logo ARR target back to MQLs, multiply the MQLs by your trailing cost per MQL to get program spend, and add people and tools. Then compare the total with a percent-of-ARR anchor such as SaaS Capital's 8% median and write down how any gap closes.
What is a good SaaS marketing plan example?
One that shows its arithmetic. The fictional example on this page takes $8.0M of starting ARR to a $10.0M target, works the $2.4M of new-logo ARR back to 1,200 MQLs, prices them at $360,000 of program spend and spreads them across four quarters, with every rate labelled as an assumption.