B2B Customer Segmentation: A 5-Test Qualifying Score
A working guide to b2b customer segmentation: a 5-test score for qualifying segments, a hard cap on how many you can run, and the CRM fields that prove it.
In August 2026 I worked through eight of the pages ranking on page one of Google for b2b customer segmentation. All eight list the variables you can cut a market on. Two put a number on how many segments a company should run. None of the eight gives a test with a pass mark for deciding whether a proposed segment deserves its own budget, its own owner and its own messaging.
That gap is the whole job. Naming the variables takes an afternoon. Deciding that eleven proposed segments are actually two, and defending the cut to the people whose slide got deleted, is the part that decides whether the model survives contact with a planning cycle.
Segmentation work fails in a specific way. It produces a good-looking deck, a set of names nobody uses in a pipeline review, and a reporting layer that cannot tell you the win rate for any of the groups it invented. Twelve months later someone reruns the analysis from scratch.
My position is that a segment earns its own go-to-market motion only when it clears five tests at once, and that almost no company can operate more than four such segments at the same time. Everything below is built to make that cut fast and defensible.
What Is B2B Customer Segmentation?
B2B customer segmentation is the practice of dividing a company’s addressable market and installed base into a small number of groups that buy for different reasons, through different committees, and respond to different proof. A segment qualifies only when it is large enough to fund, reachable from data you hold, and separable in the CRM.
A group that buys for the same reason as everyone else is not a segment, whatever the firmographic data says. Manufacturing and logistics may look like two rows in a spreadsheet and behave as one buyer with one trigger and one objection set.
A group you cannot isolate in your own systems fails the same way. Isolable has a narrow meaning here: an automated rule can assign the accounts today, without an analyst building the list by hand.
Where the Standard B2B Segmentation Guides Stop
Below is what those eight page-one results actually contain. The counts are mine, taken from the pages as they stood in August 2026.
| Page one result | Segmentation types named | States how many segments to run | Gives a qualifying test with a pass mark |
|---|---|---|---|
| Twilio | 5 | No | No |
| Demandbase | 5 | No | No |
| ZoomInfo | 7 | No | No |
| SurveyMonkey | 5 | Yes, three or four | No |
| Leadfeeder | 6 | No | No |
| B2B International | 7 | Yes, 3 or 4 | No |
| Brandspeak | 5 | No | No |
| LinkedIn guide | 12 | No | No |
The variable lists are broadly correct and broadly identical: firmographic, technographic, behavioral, needs-based, intent, journey stage, value tier. A reader who absorbs all eight comes away able to name every axis and no closer to a decision.
The two useful numbers on page one belong to the research agencies rather than the software vendors. B2B International writes that “the average business-to-business study typically produces 3 or 4” segments, and adds that “the volume of data is such that achieving enough granularity for more than 3 or 4 b2b segments is often impossible”. SurveyMonkey’s guide states flatly that “B2B markets generally have three or four.”
Both are describing what falls out of the data. Neither says what happens when a VP wants a fifth, and that is the conversation everyone reading this actually needs to win.
Which Segmentation Variables Predict Buying Behavior
The eight guides name between five and twelve variables each and treat the list as flat. The variables differ sharply on the only two questions the score cares about: does this group buy through a different process, and does it buy for a different reason.
| Variable | What it reliably predicts | Typical score on buying behavior | Typical score on value driver |
|---|---|---|---|
| Firmographic: industry, headcount, geography | Budget ceiling, procurement complexity | 1 | 1 |
| Regulatory exposure | Buying group composition, cycle length, required proof | 2 | 2 |
| Technographic: the stack already in place | Integration work, displacement path | 1 | 1 |
| Trigger event: migration, funding, breach, audit | Timing, budget source, urgency | 2 | 2 |
| Job to be done and value driver | The proof points that close the deal | 1 | 2 |
| Buying process maturity | Who runs the evaluation and how long it takes | 2 | 1 |
| Intent and journey stage | Timing, and nothing else | 0 | 0 |
| Value tier by contract size | Coverage cost and support model | 1 | 1 |
Intent and journey stage are timing signals. They tell you when to contact an account inside a segment you already defined, and running them as segments produces a model that reshuffles itself every week.
The variables scoring 2 in both columns share one property: they change who sits in the room and what that room needs to see. Regulatory exposure does that, because a compliance function joins the evaluation and asks for evidence the core buyer never requests. A migration trigger does it because the budget comes from a project rather than a line item. Industry and headcount usually do neither, which is why so many firmographic segmentations end up describing the same buyer twice under different names.
If the variable you segmented on does not change the composition of the buying group, content written for that segment cannot be more relevant to that group than the core content already is.
A quick screen before you commit to a variable: write the one sentence that would appear on a landing page for that segment and would be wrong on any other page you own. If the sentence will not come, the variable is a filter.
Why B2B Customer Segmentation Models Collapse
Only one of the failures below is an analysis problem, which is why rerunning the analysis is the standard response and almost never works.
| Failure | The evidence | What it does to the model |
|---|---|---|
| The buying group varies more than the account does | Gartner surveyed 632 B2B buyers in August and September 2024 and found buying groups “ranging from five to 16 people across as many as four functions” (Gartner, 2025) | Firmographics alone cannot predict who you will be selling to. Two identical 800-person software companies can run a five-person decision or a sixteen-person one, and those are different sales motions. |
| Segmenting to the individual makes it worse | The same Gartner study found content tailored for buying-group relevance improved consensus by 20%, while content aimed at individual-level relevance had a 59% negative impact on consensus | The finer you slice, the more you write to one person in a room of twelve, and the harder that room finds it to agree. Micro-segmentation buys precision and pays for it in consensus. |
| Nobody can operate what got approved | Bain surveyed 1,263 senior commercial executives across 18 industries in January 2025 and found 82% of companies saying they run sales plays while only 21% realize the full value (Bain, 2025) | Segmentation carries the same execution gap for the same reason: the deck is a one-off cost and the operating cost is quarterly and permanent. |
For the buying-group side of this in more depth, the difference between an account-level profile and a person-level one is covered in ICP vs buyer persona.
How Many Segments a Team Can Operate at Once
Every live segment carries a fixed quarterly cost. That cost recurs, and it is paid by five different people.
| What one live segment consumes every quarter | Who pays it |
|---|---|
| An owner with the segment written into their goals | Product marketing |
| A current message doc and at least one refreshed proof point | Product marketing |
| A campaign with its own budget line and creative | Demand generation |
| A sales play and objection set the reps can find in 30 seconds | Enablement |
| A pipeline, win-rate and cycle-time report filtered to the segment | Revenue operations |
Run that table against your own headcount before you agree to a number of segments. Every row is work the team already does once for the core, on top of the standing product marketing workload, which is why the marginal cost of a fifth segment gets underestimated. My rule is one named segment per product marketer as a primary responsibility, plus the core, which puts a three-person PMM team at the core plus two segments and makes four the ceiling for any team under roughly eight PMMs.
That lands in the same place as the research agencies, from the opposite direction. B2B International gets to three or four because the data will not support more granularity. I get to four because the calendar will not.
Cost is not the only reason to hold the line:
- A segment you cannot report on separately costs more than it returns, because it adds a dimension to every dashboard and answers no question.
- A segment with no owner degrades within two quarters. The message doc goes stale first, then the campaign stops, then the sales play stays live and starts contradicting the website.
Cap the count at four. Keep a written waiting list of the candidates that did not make it, with their scores, so the fifth request has somewhere to go that is not the roadmap.
The Five-Test Qualifying Score for a Segment
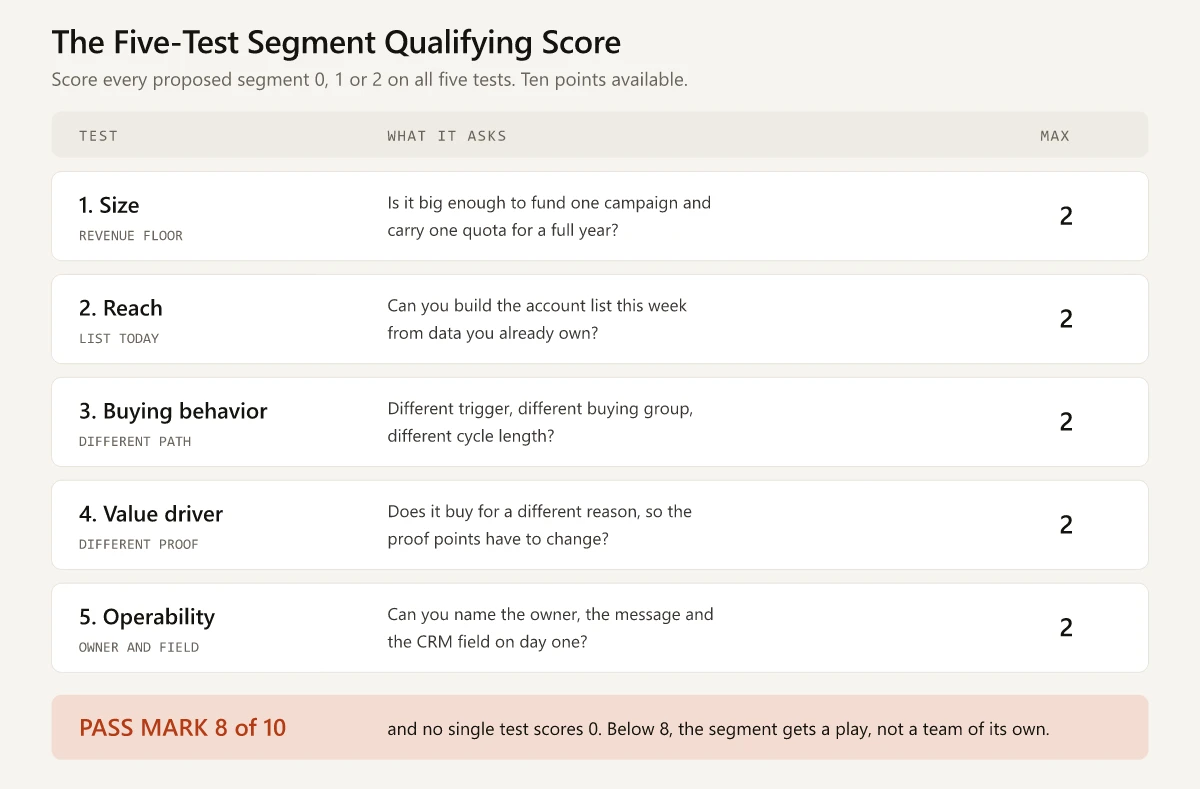
Score every proposed segment on five tests, 0 to 2 each. Ten points available. Eight is the pass mark, and any single zero disqualifies the segment regardless of total.
| Test | Score 0 | Score 1 | Score 2 |
|---|---|---|---|
| Size | Cannot fund one campaign | Funds a campaign but not a quota | Funds a campaign and carries a quota for a year |
| Reach | No way to build the list | List possible with purchased data and manual work | List buildable this week from data you already own |
| Buying behavior | Same trigger, same group, same cycle as the core | One of the three differs | Different trigger, different buying group, different cycle length |
| Value driver | Buys for the same reason as the core | Same reason, different emphasis | Different reason, so the proof points change |
| Operability | No owner, no field, no report | Owner named, tooling unresolved | Owner, message and CRM field all nameable on day one |
The tests are ordered on purpose. Size and reach are cheap to check and kill most candidates in ten minutes. Buying behavior and value driver separate a real segment from a reporting cut. Operability comes last because it is the test people skip, and it is the only one of the five a room cannot talk its way past: either a field, an owner and a report can be named on the day, or they cannot.
A few notes on scoring it honestly:
- Score with data in the room. Closed-won counts, median cycle length and win rate by candidate segment, pulled before the meeting.
- One hour per candidate, maximum. If the room cannot agree on a score in an hour, the segment is not distinct enough to defend to a sales team.
- Write the evidence next to the score. A 2 on buying behavior with no evidence beside it is a 1.
- Rescore annually, not continuously. Segments that get relitigated every quarter never get operated.
The Six Numbers to Pull Before Scoring
Scoring without data turns into a seniority contest. Six pulls take a revenue operations analyst about a day and settle most of the argument before the meeting starts. Run each one per candidate segment, against the last eight closed quarters.
- Closed-won count and total contract value. This feeds the size test directly and needs no interpretation.
- Win rate against the blended rate. A candidate sitting within a point or two of the blended number is rarely a distinct buyer.
- Median days from opportunity creation to closed-won. A cycle running 30% longer or shorter than the core is strong evidence on the buying-behavior test.
- Average contact-role count on won opportunities. The cheapest available proxy for buying-group size, and the one number you can check against Gartner’s five-to-sixteen range.
- Gross retention and expansion at twelve months. A candidate that acquires well and retains badly is usually a fit or pricing problem that no campaign will fix.
- Count of accounts an automated rule can identify today. This feeds the reach test, and it kills more candidates than any other pull.
The report specification, in the form most revenue operations teams will accept:
Report: Segment candidate baseline
Object:   Opportunity
Filter:   CloseDate = LAST 8 FISCAL QUARTERS
          StageName IN (Closed Won, Closed Lost)
Group by: candidate_segment   (scratch formula field or manual tag)
Columns:  count(Id), sum(Amount), win_rate,
          median(CloseDate - CreatedDate),
          avg(OpportunityContactRole.count)
Compare:  the same columns with no segment filter (the blended baseline)
Save it as a report rather than a spreadsheet, because the rescore in twelve months has to run the identical query. Tag the candidates in a scratch field before the pull, so the analysis and the eventual production field share one definition rather than two.
Scoring Four Proposed Segments
Take a vendor selling observability software to engineering organizations. Planning throws up four candidate segments. Here is how the score sorts them.
| Candidate segment | Size | Reach | Buying behavior | Value driver | Operability | Total | Verdict |
|---|---|---|---|---|---|---|---|
| Financial services enterprises | 2 | 2 | 2 | 2 | 2 | 10 | Own motion |
| Companies running Kubernetes | 2 | 2 | 1 | 1 | 1 | 7 | Same motion, new proof |
| Teams replacing an on-prem monitoring stack | 1 | 1 | 2 | 2 | 1 | 7 | Play, no team |
| Mid-market accounts in EMEA | 2 | 2 | 1 | 0 | 1 | 6 | Fails on a zero |
Financial services enterprises clear every test: a buying group that adds risk and compliance, a cycle stretched by a security review, audit evidence rather than developer speed as the value driver, and an industry field already sitting on the account record. That one earns an owner.
Kubernetes users are the interesting failure. The group is enormous and trivially findable with technographic data, which is exactly why it feels like the obvious segment. Nothing about the purchase changes: same committee, same trigger, same reason to buy. What changes is the evidence, so it gets a proof swap and a landing page instead of a team.
The migration segment reaches the same total from the opposite direction. It is small at any moment and hard to detect before the buyer raises a hand, but the trigger is an event, the budget comes from a project rather than a line item, and the buyer is paying for continuity rather than capability. That combination makes a competitive play with a named owner rather than a standing segment with a headcount line.
Mid-market EMEA fails despite a respectable total. A zero on value driver means the region changes nothing about why anyone buys. Geography that only changes the language of the email is a reporting cut, and the report someone brings to defend the region usually proves less than it looks like it does. Search Console’s country report carries the same flaw: impressions from a country record where Google showed a page rather than demand in that country’s language. Keep it as a filter on the dashboard and stop calling it a segment.
Those scores are an illustration, and they are worth nothing without evidence behind each digit. When you run this on your own candidates, hold every 2 to a specific standard:
| Test | The evidence that justifies a 2 |
|---|---|
| Size | Closed-won contract value over eight quarters that clears the fully loaded cost of one product marketer plus one campaign budget |
| Reach | A saved report returning the account list from fields already populated, with no manual enrichment step in the middle |
| Buying behavior | A median cycle at least 30% away from the core, or a contact-role count at least three higher on won deals |
| Value driver | Two won deals whose recorded primary reason differs from the core, and two losses where the core pitch was the stated reason for losing |
| Operability | A named owner, a drafted picklist value, and a revenue operations ticket number |
Anything scored 2 without that evidence is a 1, and the difference between a 7 and an 8 is exactly the difference between a segment that gets staffed and one that does not.
Three Limits of the Qualifying Score
The score assumes history and judges everything against it. Where that assumption breaks, the workaround keeps the five tests intact and changes the evidence behind them.
| Limit | Who it hits | What to run instead |
|---|---|---|
| It assumes eight quarters of clean closed-won data with contact roles attached | Companies below roughly $5M in ARR, and anyone who migrated CRM inside the scoring window | Score buying behavior and value driver from win-loss interviews rather than the CRM, accept the lower confidence, and set the rescore at six months rather than twelve |
| It is blind to deliberate bets | A market you are entering on purpose, which has no history and so scores near zero on size and reach by construction | Run it as a named initiative on its own review cadence, outside the operating segment count, because it consumes different resources and is judged on different evidence for the first year |
| It says nothing about product fit | Any segment that acquires well and retains badly, which reads as a healthy win rate sitting on top of poor retention | Pull gross retention in the same session as the win rate and treat the gap between them as its own finding rather than as a scoring input |
Customer Profiling and Segmentation: Two Different Jobs
Customer profiling and segmentation get used as synonyms in most vendor content, and the confusion has a cost. Segmentation is the cut. Profiling is the write-up of one group after the cut survives.
| Artifact | What it answers | Grain | Who owns it |
|---|---|---|---|
| Segment | Which groups buy differently enough to justify separate treatment | Market | Product marketing |
| Ideal customer profile | Which accounts inside a segment are worth pursuing | Account | Product marketing with sales |
| Buyer persona | Who in the buying group needs convincing, and of what | Person | Product marketing |
| Account profile | What is true about this specific logo | One account | Sales |
Running these in the wrong order produces the failure mode I see most often in published segmentation work: a well-written profile for a group that was never a segment. The tell is a profile whose trigger, buying group and value driver match the core profile with the industry name swapped, so read the two documents side by side before either one circulates.
Do the cut first, with the score. Profile only what passes. The mechanics of the person-level write-up, including the buying-group roles that Gartner’s research says have to agree with each other, are covered in how to build a B2B buyer persona.
One more sequencing note. A segment that scores 8 or above almost always needs its own positioning statement, because a different value driver means a different alternative and a different reason to care. If the segment survives the score but reuses the core positioning word for word, one of those two things is wrong. Market positioning covers how to write the second one without forking the brand.
How to Build a Customer Segmentation Matrix
The score tells you whether a segment qualifies. A customer segmentation matrix tells you what it gets. Plot the candidates on two axes: revenue potential on the vertical, and how differently the group buys on the horizontal.
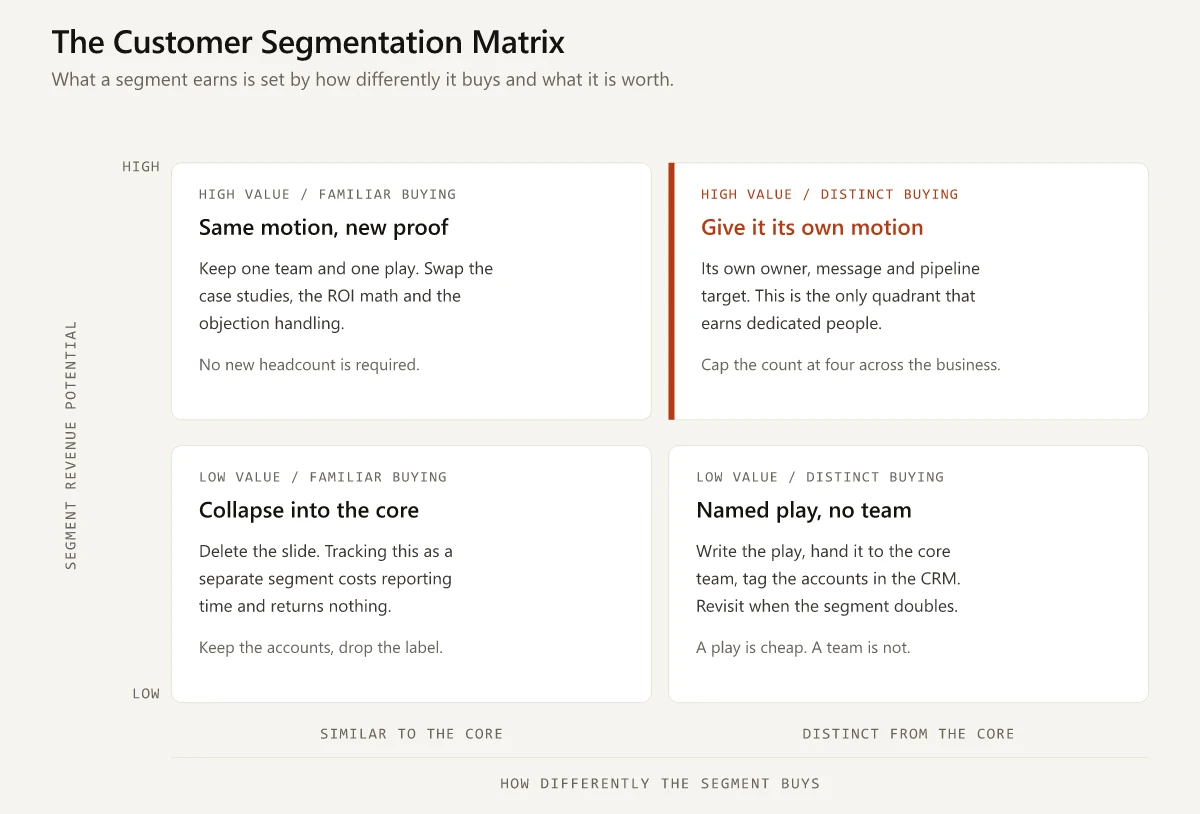
Reading the four quadrants:
- High value and distinct buying earns its own owner, message and pipeline target. This is the only quadrant that justifies dedicated people, and the cap of four applies here specifically.
- High value with familiar buying keeps the existing team and play. Swap the case studies, the ROI math and the objection handling, and change nothing else.
- Low value with distinct buying gets a written play handed to the core team, plus a CRM tag so you can see whether it grows. Revisit when the segment doubles.
- Low value with familiar buying gets deleted as a label. Keep the accounts, drop the name, and reclaim the dashboard column.
The matrix is also the right artifact for the argument about the fifth segment. A request to add one becomes a request to move a specific candidate into the top-right quadrant, which is a claim about revenue and buying behavior that can be checked against closed-won data rather than a preference.
For the account-level version of this ranking, where the unit is a logo rather than a group, prioritizing accounts in ABM covers the scoring model that sits underneath a target list.
The Assets That Fork Between Segments
A segment in the top-right quadrant does not get a parallel copy of everything. Forking the full asset set is how a two-segment model becomes unmaintainable in three quarters. A short list of assets carries the difference and the rest stay global.
| Asset | What forks per segment | What stays global |
|---|---|---|
| Positioning | The alternative, the value driver, the proof | The category and the company promise |
| Website | One landing page per segment | Product pages, pricing, documentation |
| Sales deck | The problem, proof and ROI slides | Company, category and roadmap slides |
| Case studies | At least two named references per segment | Format, length, approval process |
| Objection handling | The three objections unique to the segment | The rest of the battlecard |
| Pricing | Packaging and contract terms, and only when the buying process forces it | List price and discount policy |
| Onboarding | The first-value milestone | The implementation runbook |
Most of the difference lives in six or seven artifacts. Everything else being shared is what makes four segments survivable for a small team, and it is the reason the cap holds at four rather than collapsing to two.
One rule keeps the fork honest. If an asset forks, someone owns both versions and both get refreshed on the same cycle. A forked sales deck that only gets updated for the core segment is worse than no fork, because reps find the stale version and read it out loud to a buyer who knows more than it does.
Customer Success Segmentation by Contract Value
Customer success segmentation follows a different variable than marketing segmentation, and mixing the two is a common and expensive mistake. Marketing segments on how a group buys. Customer success segments on what an account is worth and how much help it needs to stay.
SaaS Capital’s September 2025 retention benchmarks make the case for contract value as the primary cut: “For retention, benchmarking by ACV is the best starting point. More than by company age, revenue level, or industry, companies that share a similar selling price have the most in common. They will be organized similarly, go to market similarly, and support customers similarly” (SaaS Capital, 2025). The same analysis reports that higher net revenue retention correlates with higher ACVs.
A coverage model that follows from that, with the ratios set to what I would defend in a planning review rather than to a published benchmark:
| ACV band | Coverage | What the account gets | The early warning to watch |
|---|---|---|---|
| Under $10k | Pooled and digital | In-product guidance, lifecycle email, community | Feature usage decay over 30 days |
| $10k to $50k | One-to-many CSM | Cohort office hours, scheduled health reviews | Support ticket volume and admin turnover |
| $50k to $250k | Named CSM, around 30 accounts each | Written success plan, two business reviews a year | Executive sponsor change |
| Above $250k | Named CSM plus technical account manager, around 10 accounts each | Joint success plan, mapped sponsors, quarterly reviews | Usage against contracted entitlement |
Coverage tiers are set by ACV, and the go-to-market segment travels alongside as a second field rather than replacing it, because a financial services account at $12k and a financial services account at $400k need the same message and completely different attention. A tier change follows the contract rather than the relationship, so an account that renews down moves down.
Benefits of Customer Segmentation You Can Measure
The benefits of customer segmentation are usually listed as adjectives: sharper targeting, better personalization, smarter spend. None of those survive a budget review. Each one has a number attached, and the number is already in a system you own.
| Claimed benefit | The number that proves it | Where it already lives |
|---|---|---|
| Sharper targeting | Win rate by segment against the blended rate | CRM opportunity report |
| Shorter cycles | Median days from creation to closed-won, by segment | CRM |
| Better retention | Net revenue retention by segment | Billing plus CRM |
| Cheaper acquisition | CAC by segment | Ad platforms plus CRM |
| Better messaging | Reply and meeting rates by segment | Sales engagement tool |
| Better roadmap input | Feature requests weighted by segment revenue | Product feedback tool |
Set the baseline before you launch the model, because the blended number is the only comparison anyone will accept later. A segment that does not beat the blended win rate within three quarters is either wrong or unstaffed, and both diagnoses point at the same conversation.
The arithmetic that wins the budget conversation is smaller than most teams expect. A segment carrying 60 opportunities a year at a $40,000 average deal size is working with $2.4M of annual opportunity value. Moving its win rate three points above the blended rate returns roughly $72,000 in incremental closed-won revenue, which is inside the loaded cost of the product marketer running it. A five-point move covers the campaign budget as well. Run that calculation for each surviving segment before you commit to it, and run it again at the rescore with the real numbers in place of the estimates.
Bain’s January 2025 commercial excellence survey put improving customer segmentation among the top three priorities respondents named for raising productivity that year, alongside frontline coaching and training and optimizing market spending (Bain press release, 2025). Bain’s analysis of the same survey found companies running structured sales play systems posted 2.2 times the average growth rate of those that did not.
Segments That Live in the Deck but Not in the CRM
A segmentation launches, the deck circulates, and the segment never becomes a field. Six months later nobody can produce a win rate by segment, so nobody can defend the model, so the next planning cycle starts from scratch.
Bain found that 70% of companies fail to effectively integrate their sales plays into their revenue technology tools, across a survey of more than 1,200 senior commercial executives in 18 industries. Segmentation sits one level above sales plays and inherits the same gap.
The fix is a data specification written on the same day as the segment definitions:
- One field, on the account object. A single picklist with at most five values: four segments plus Core. Two competing segment fields is the same as none.
- Populated by rule, not by reps. Write the assignment rule for each value in one sentence a revenue operations analyst can implement without asking a follow-up question.
- Stamped on the opportunity at creation. The account can be re-tagged later; the deal has to keep the segment it was sold into, or your historical win rates rewrite themselves.
- An unassigned report every month. Target under 5% of active accounts with no segment. Anything higher means the assignment rules do not cover the market you actually sell to.
- One owner named in the field description. The person who defends the definition when sales asks why an account moved.
Segments have to be mutually exclusive at the account level, or the field cannot be a picklist and every report built on it double-counts.
A financial services company that is also mid-market matches two candidates at once. Resolve it with a precedence list rather than a set of conditions, ordered from the strongest predictor of buying behavior to the weakest:
- Regulated industry, where regulation changes the buying group
- Active trigger event in the last two quarters
- Contract value band
- Core
The first rule that matches wins, and the account carries one value. Anything matching nothing gets Core, which is why Core is a real picklist value rather than an empty field. Accounts with a blank segment are invisible to every filter that uses it, and they pile up at the edges of the data until the unassigned report finds them.
The precedence list also gives you a migration path. Adding or collapsing a segment later means inserting or deleting one rule and rerunning the assignment, rather than rewriting a formula field nobody remembers building.
Ship the field in the same week as the deck, and backfill it across the same eight quarters the score was built on, so the baseline report and the live report share one definition rather than two.
How to Collapse a Segment That Fails the Test
Cutting segments is the part of this work that needs a rule, because without one it turns into a negotiation and the person who talks longest wins.
Merge on the value driver:
- A candidate scoring below 8 merges into the nearest segment that shares its value driver. Value driver is the merge key, because a shared reason to buy means shared proof and shared messaging, which is what the merged team has to produce.
- A candidate with a zero merges regardless of its total. The zero identifies the test it cannot pass, and totals hide that.
- Two candidates whose only difference is firmographic merge into one and keep the broader name. Industry becomes a filter on the report instead of a segment.
Write the collapse down. One line per deleted candidate: the score, the test it failed, and where its accounts went. That record is what stops the same segment being proposed again in nine months by someone who was not in the room, and it makes the annual rescore a review rather than a restart.
The accounts never disappear in a collapse. Only the label does, along with the quarterly cost of maintaining it.
Handling Pushback on a Segmentation Decision
The same objections come back on every cut, and each has an answer that does not require reopening the analysis.
| Objection | The question that settles it | Where it usually lands |
|---|---|---|
| ”My accounts are different.” | Do they buy differently? That is a separate question. Score the trigger, the buying group and the value driver on the spot. | Usually the proof-swap quadrant, which arrives with real deliverables attached rather than a brush-off. |
| ”We will lose the vertical story.” | Which asset actually stops being produced? Case studies, proof points and industry pages are content decisions. | The vertical story survives without a segment behind it. What a vertical does not automatically earn is an owner and a quota. |
| ”Sales already runs it as a segment.” | Which of the five tests can you evidence, with won and lost deals on the table? | Sales sits closer to the buying group than marketing does, so if they can evidence buying behavior and value driver, the candidate scored wrong and gets rescored with their data in the room. If they cannot, what they have is a territory. |
Set the rescore date at launch, twelve months out, and publish it alongside the model. A segmentation with no scheduled review invites a permanent argument, and one that gets reopened every quarter never gets built.
One governance rule I would hold without exception: definitions change on a calendar, account assignments change continuously. Definitions that drift mid-year make every historical comparison meaningless, which destroys the only evidence that would have justified the model in the first place.
A 30-Day Plan to Ship B2B Customer Segmentation
Four weeks is enough for a first pass if the analysis stays bounded. The point of the deadline is to stop the modeling phase from expanding to fill the year.
| Week | The work | What exists at the end of it |
|---|---|---|
| 1. Assemble the evidence | Pull eight quarters of closed-won and closed-lost. For every candidate segment on the table, get win rate, median cycle length, average deal size and gross retention. Collect candidates from wherever they currently live, including the ones sales invented and never wrote down. | A saved baseline report and a written candidate list |
| 2. Score | One hour per candidate, one room, the five tests, evidence written next to every score. Nothing gets a 2 without a number behind it. | Two to four survivors out of ten or more candidates |
| 3. Cut and specify | Collapse everything under 8 using the merge rules and write the one-line record for each. Hand revenue operations the field specification, the picklist values and the assignment rule per value. | A deleted-candidate log and an agreed backfill date |
| 4. Arm the survivors | One message doc and one refreshed proof point per surviving segment. One sales play per segment in whatever tool the reps actually open. | A published win-rate-by-segment report with its baseline set, and a rescore booked twelve months out |
The order matters more than the speed. Scoring before profiling is what keeps the model small, and specifying the field before the campaign is what keeps it measurable.
Run the Test Before the Next Planning Cycle
Most B2B customer segmentation projects do not fail on analysis. They fail because eleven groups get approved, nobody can staff eleven groups, and the reporting layer never learns their names. A scored test with a pass mark of 8, a hard cap of four, and a field in the CRM turns that into a decision the team can defend twelve months later.
Open your CRM and count the accounts with no segment on them. Start with the field.
Frequently Asked Questions
How many customer segments should a B2B company have?
Three or four operating segments plus a core is the working ceiling for most B2B companies. B2B International reports that the average business-to-business segmentation study produces 3 or 4 segments, and SurveyMonkey's guide says the same. The constraint is not analysis, it is staffing: every live segment needs an owner, a message, a campaign budget and a report, every quarter.
What is the difference between customer profiling and segmentation?
Segmentation splits a market into groups that buy differently. Profiling describes one of those groups in enough detail to act on it: firmographics, the buying group, the trigger, the value driver and the proof it needs. Segmentation is the cut, profiling is the write-up, and doing the profile first is how teams end up with segments they cannot count.
What is a customer segmentation matrix?
A customer segmentation matrix plots candidate segments on two axes, usually revenue potential against how differently the group buys. It tells you what each segment earns rather than just what it is called. Only the high-value, distinct-buying quadrant justifies its own owner, message and pipeline target. The rest get a play, a proof swap, or nothing.
How does customer success segmentation work?
Customer success segmentation sets coverage by what an account is worth and how much help it needs, usually banded by annual contract value. SaaS Capital's 2025 retention benchmarks found that higher net revenue retention correlates with higher ACV, which is why pooled digital coverage, one-to-many CSMs and named CSMs sit on separate ACV bands rather than on industry.
What are the benefits of customer segmentation in B2B?
The benefits of customer segmentation only count when they show up as numbers you already collect: win rate, sales cycle length, CAC and net revenue retention, each reported by segment rather than blended. Bain's 2025 commercial excellence survey found improving customer segmentation named among the top three productivity priorities for the year, alongside frontline coaching and market spend optimization. None of that shows up in a report unless the segment is a field you can filter those numbers by.