Marketing Mix Modeling vs Attribution vs Incrementality
Marketing mix modeling vs attribution vs incrementality: what each method measures, what it needs, when each one lies, and a decision rule for picking one.

Switch off a brand-search campaign and two measurement systems will hand you opposite answers about the same money. Last-click attribution has been reporting brand search as one of the best-converting lines in the account. eBay ran the test in March 2012: it halted brand-keyword paid search on Yahoo! and MSN while continuing to buy the same terms on Google, then used Google as the control in a difference-in-differences. Tom Blake, Chris Nosko and Steven Tadelis found that “almost all (99.5 percent) of the forgone click traffic from turning off brand keyword paid search was immediately captured by natural search traffic from the platform”, and concluded that brand-keyword ads have “no measurable short-term benefits” (NBER working paper 20171, published in Econometrica in 2015). eBay had been paying for clicks that organic results delivered free the moment the ads stopped.
I would believe the experiment. The dashboard counted clicks that happened before a purchase. The experiment observed a version of the world where the ad never ran, and then compared. Only one of those two things is evidence about cause.
That disagreement is what people are really arguing about when they argue marketing mix modeling vs attribution, and the argument is usually framed as a two-way bake-off with a winner. The three methods are not competing accuracy claims about one question. They answer three different questions, and they disagree because of how each one is built.
This post compares what each method measures, the conditions under which each one produces a wrong answer, what each costs to run, and a decision rule keyed to what your team actually has.
Marketing Mix Modeling vs Attribution vs Incrementality: The Short Answer
| Attribution | Marketing mix modeling | Incrementality | |
|---|---|---|---|
| Question it answers | Which recorded touchpoints preceded this conversion? | How does aggregate spend track aggregate outcomes over time? | What would have happened without this spend? |
| Unit of analysis | A user, session or conversion path | A week in a geography or a national week | A randomized cell of users, geos or time periods |
| Type of claim | Descriptive | Correlational, with causal assumptions | Causal, within the tested conditions |
| Minimum inputs | User-level event tracking and a lookback window | Two to three years of weekly spend and outcome data | The ability to withhold spend from a group large enough to detect the effect |
| Blind spot | Any channel it cannot click-track, and cause itself | Any channel whose spend never varied | Anything outside the cell, window and creative you tested |
| Best used for | In-channel optimization: keywords, creative, audiences | Cross-channel budget allocation, including offline | Settling whether a channel or a budget level is worth funding |
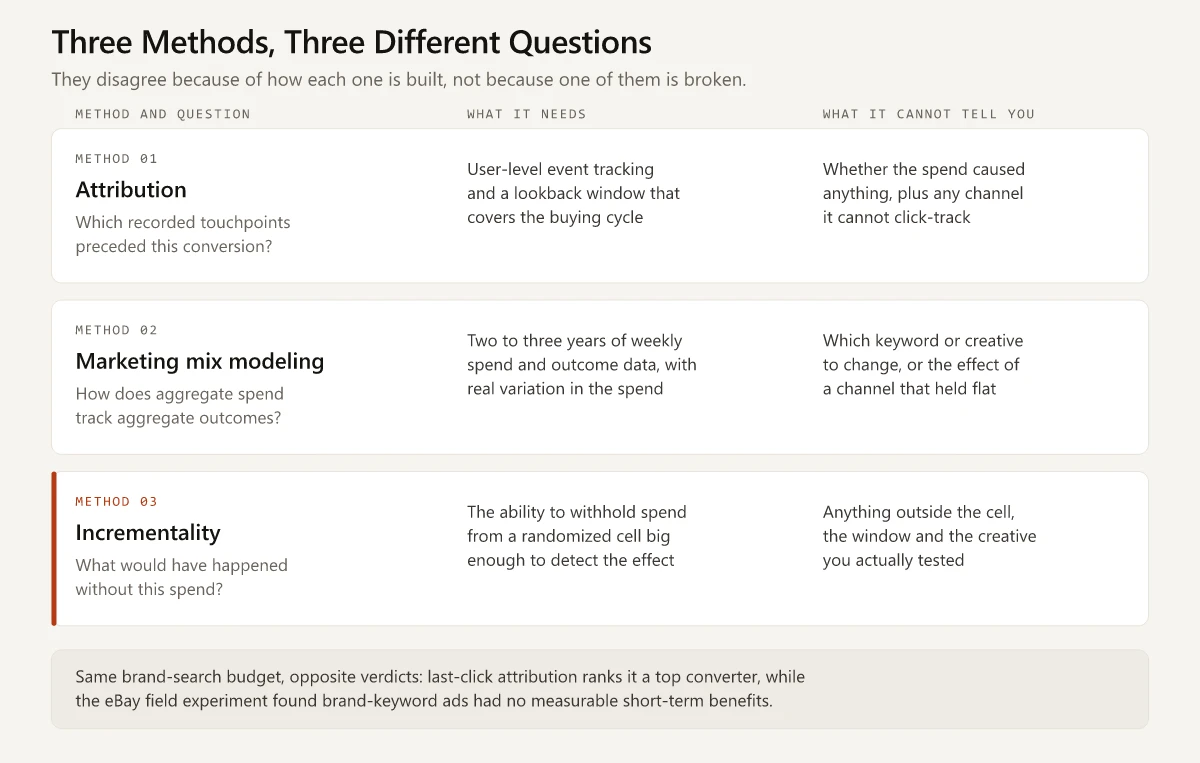
A team that treats these as rival accuracy claims will re-litigate which dashboard is right every quarter and never resolve it, because none of the three is trying to answer the other two’s question.
What Attribution Measures, and Where It Stops
Attribution takes a conversion that already happened and divides credit among the touchpoints your tracking recorded before it. Every attribution model is a credit-splitting rule applied to observed paths. No splitting rule converts a correlation into a cause.
The rules on offer have narrowed sharply. Google’s own documentation states that “the first click, linear, time decay, and position-based attribution models are no longer available as of November 2023” (Analytics Help, attribution models). What survives in Google Analytics 4 is data-driven attribution plus two last-click variants: paid and organic last click, and Google paid channels last click.
The lookback window is the second constraint, and it is set by a product default rather than by your sales cycle. Per the key event lookback window documentation, acquisition key events default to 30 days with 7 days as the alternative, all other key events default to 90 days with 30 and 60 as the alternatives, and engaged-view key events default to 3 days. A touchpoint outside that window is not credited less. It is not credited at all.
What attribution is good at:
- Ranking keywords, creatives and audiences inside one channel, where the alternative is guessing
- Producing an answer today rather than next quarter
- Catching operational breakage: a broken tag, a landing page that stopped converting, a campaign that spent without a single recorded click
- Describing the shape of a buying journey, which is where customer journey analytics starts
What it structurally cannot do is tell you what would have happened if the campaign had not run. It never observed that world. Feed the same event data through data-driven attribution and through last click and you get two different budget recommendations from one set of facts, which is a useful reminder that the model is a rule you chose rather than a measurement you took.
What Marketing Mix Modeling Actually Measures
A marketing mix model regresses an aggregate outcome, usually weekly revenue or conversions, on aggregate spend by channel plus control variables like seasonality, price and distribution. It adds adstock terms for carryover and saturation curves for diminishing returns, then reports a contribution and a return figure per channel.
The tooling stopped being a six-figure consulting purchase. Google’s Meridian went open to everyone on 29 January 2025, described by Harikesh Nair as “the open-source marketing mix model (MMM) built by Google, available to all marketers and data scientists”. Meta ships an alternative, Robyn, described in its own README as “an experimental, semi-automated and open-sourced Marketing Mix Modeling (MMM) package from Meta Marketing Science”.
| Meridian (Google) | Robyn (Meta) | |
|---|---|---|
| Repository | google/meridian | facebookexperimental/Robyn |
| License | Apache-2.0 | MIT |
| Language | Python 3.11 to 3.13 | R and Python |
| Hardware guidance | Recommends a minimum of one GPU | None stated in the README |
The binding constraint is the data history rather than the software. Google’s guidance on collecting data for Meridian asks for a minimum of two years of weekly data for geo-level models and three years for national-level models, or three years if all you have is monthly data.
The reason is degrees of freedom, and Meridian’s amount of data needed page works it out explicitly for a national model.
| Model setup | Parameters | Weekly observations | Data points per parameter |
|---|---|---|---|
| 12 media channels, 6 controls, 8 knots, 2 years of data | 26 | 104 | 4, which the documentation judges “too low to estimate the model reliably” |
| 3 media channels, 5 controls, 2 knots, 3 years of data | 10 | 156 | About 16 |
The second row is Google’s own worked fix: combine the 12 channels into three, lower the knots to two, remove a control that is not a true confounder, and move to three years of history, which leaves “156 data points to estimate 10 parameters”.
That arithmetic is the whole story of why mix models fail at small companies. A Series A SaaS business with 14 months of spend history and six channels does not have a data problem it can solve with a better package.
Where marketing mix modeling earns its place:
- Channels with no click at all: linear TV, radio, out-of-home, podcast, sponsorships, events
- Budget splits across channels, which no single ad platform can arbitrate because none of them sees the others
- Aggregated measurement that never touches a user identifier, which is why the same Google post calls mix models a way to measure “in a privacy-centric way”
- Long-horizon effects, since adstock is designed to carry an impression’s influence across weeks
What it cannot do is tell you which keyword to pause or which creative to kill. There are no users in the model, only weeks.
Incrementality vs Attribution: What Each One Answers
Attribution and incrementality get treated as two flavors of the same measurement. They are two different claims about the same conversion. Attribution says a touchpoint appeared on the path. Incrementality says the conversion would not have happened without it.
How to Define Incrementality
Incrementality is the share of an outcome that would not have occurred without the marketing spend. It is a property of the spend, not a report you can pull from a platform. You estimate it by withholding the spend from a randomized group and measuring the gap in outcomes between the exposed group and the withheld one.
The reason this matters more than it sounds is that ad platforms target the people most likely to convert:
- A retargeting pool is, by construction, made of people who already visited your pricing page
- Attribution credits the retargeting ad for their purchases because it was recorded on the path
- Incrementality asks how many of that pool would have bought without the ad
The most direct evidence on how far the two diverge comes from Brett Gordon, Robert Moakler and Florian Zettelmeyer, who analyzed 663 large-scale advertising experiments at Facebook, with over 5,000 user-level features available to the non-experimental methods (Close Enough? A Large-Scale Exploration of Non-Experimental Approaches to Advertising Measurement, Marketing Science, 2023). They compared the experimental result against two serious statistical approaches: double/debiased machine learning (DML) and stratified propensity score matching (SPSM).
| Funnel stage | Experimental lift (RCT) | DML estimate | SPSM estimate |
|---|---|---|---|
| Upper funnel | 29% | 83% | 173% |
| Middle funnel | 18% | 58% | 176% |
| Lower funnel | 5% | 24% | 64% |
Those are median lifts by funnel stage, taken across the 1,673 experiment-and-conversion-event pairs those 663 experiments produced, which the paper sorts into 601 upper funnel, 475 mid funnel and 597 lower funnel. Every one of the six non-experimental estimates sits above its experimental counterpart. In raw percentage points the gap is widest at the top of the funnel, but relative to the true lift it runs the other way: the paper reports that “both observational methods perform better for upper-funnel than for mid- or lower funnel purchase outcomes”, which the authors put down to there being more scope for selection at the bottom. Their own conclusion: “despite having access to large-scale experiments and rich user-level data, we are unable to reliably estimate an ad campaign’s causal effect”.
Two well-specified statistical corrections, running on data the authors describe as “richer than what most advertisers or their measurement partners can access”, still could not recover the experimental answer.
Lift vs Incrementality
Incrementality is the underlying effect. Lift is the number a particular test reports, and the word covers several different outcomes that are easy to confuse in a deck. Google’s own comparison of lift types separates them:
- Brand Lift measures survey metrics such as ad recall, awareness, consideration and purchase intent
- Search Lift measures the impact of YouTube media on search queries
- Conversion Lift based on users measures conversion actions using user-based group splits
- Conversion Lift based on geography measures the same conversions using regional splits, which Google notes is “noisier” and cannot be sliced by demographics, but does cover cross-channel and offline conversions
A brand lift result is not evidence of incremental revenue. It is evidence of incremental recall. Both are useful, but only one belongs in a budget argument, and the substitution happens often enough that I check which outcome a lift number refers to before reading the percentage.
Incrementality Testing vs A/B Testing
Both randomize. That is where the similarity stops.
| A/B test | Incrementality test | |
|---|---|---|
| What the control sees | The other version of the thing | Nothing from this channel |
| Typical randomization unit | Visitor or session | Geography, user cohort, or time period |
| What you are comparing | Two treatments | Treatment against absence |
| Cost of the control | Opportunity cost of the worse variant | Real forgone revenue in the holdout |
| Usual failure mode | Peeking at the result before it is powered | Spillover across the holdout boundary |
The randomization unit is the practical difference. You can split visitors between two landing pages inside a session. You cannot split visitors between “sees your ads” and “does not see your ads” when the same person uses three devices and a friend forwards them a link, which is why serious holdouts are usually built at the geography level.
Three Methods, Three Verdicts on the Same Spend
The disagreement is predictable channel by channel, which makes it a diagnostic rather than a nuisance. Four common spend types, and what each method hands back:
| Spend type | Attribution reports | A mix model reports | An experiment reports |
|---|---|---|---|
| Brand search | A top-ranked converter, because the click sits immediately before the purchase | Little, if brand spend barely moved week to week | Near zero, to the extent organic results recapture the clicks the ad was buying |
| Retargeting | High conversion rates, because the pool is built from people who already visited | Whatever correlates with the weeks you scaled it | The share of that pool who would not have come back unprompted |
| Linear TV, podcast, out-of-home | Nothing at all: no click, so no row in any path | A contribution estimate, if the spend varied enough to identify one | A geo-level lift, if you can find control markets the media does not reach |
| Long-cycle B2B content | Whatever survived the lookback window, usually one late touch | A weak signal, because content spend rarely swings hard enough to identify | A holdout result, if you can withhold promotion from a region for a full cycle |
Read across a row and the three answers stop looking like a contradiction. Which method disagrees, and in which direction, is itself the finding: a line that attribution ranks near the top and an experiment scores near zero is a line pointed at demand that already exists.
The same structure explains why platform-reported conversions do not sum to your own total. An attribution window is a property of the reporting system rather than of the buyer, so each platform counts the conversions it can see under its own rules, and a buyer that two platforms both touched is counted by both. Nothing is broken there either. Each system is answering its own question honestly.
Marketing Attribution Challenges That No Model Fixes
Some of the standard marketing attribution challenges are analytics problems you can fix with better instrumentation. These are not.
Walled gardens grade their own homework. Meta, Google, TikTok and Amazon each report conversions attributed by their own rules, on their own view-through and click-through windows, using data they do not export at user level. There is no shared arbiter.
Identity breaks across devices and browsers. A buyer reads on a phone, researches on a work laptop and converts in a private window. Three sessions, one human, and no reliable join key.
The lookback window can be shorter than the sales cycle. Google Analytics 4 caps its key-event lookback at 90 days, so any touch older than the window you set is dropped rather than discounted, and the report does not tell you how much evidence fell outside it. That is the same structural gap that makes measuring SaaS content marketing so contested.
Buying groups are not buyers. One person fills the form. Five or six others read, forward and argue in a Slack thread that leaves no trace in your CRM.
Non-clickable media never enters the dataset. A podcast read, a conference booth and a billboard generate no impression record you can join to a conversion. Attribution does not undercount them. It has no row for them.
The privacy story is not the one people repeat. Chrome did not remove third-party cookies. On 22 April 2025, Anthony Chavez, VP of Privacy Sandbox, wrote that Google had “made the decision to maintain our current approach to offering users third-party cookie choice in Chrome, and will not be rolling out a new standalone prompt for third-party cookies” (Privacy Sandbox blog). Six months later the replacement plumbing went too: on 17 October 2025 Chavez wrote that Google had “decided to retire the following Privacy Sandbox technologies”, a list whose first entry is the Attribution Reporting API on Chrome and Android (Privacy Sandbox, October 2025 update). Neither decision changed anything about the five problems above. Cross-app tracking on mobile, walled-garden reporting and cross-device identity were never a cookie question.
The useful reading is that attribution’s limits are structural rather than temporary. A better tag manager does not fix any line on that list.
The Real Cost of Each Method
The cost that stops projects is rarely the license fee. It is the data history, the specialist time, and in the case of experiments, the revenue you deliberately forgo.
| Attribution | Marketing mix modeling | Incrementality | |
|---|---|---|---|
| Software cost | Usually already in the stack | Open source available (Meridian, Robyn) | Free inside Google Ads and Meta; paid tools exist |
| Hard prerequisite | Consistent UTM discipline and event tracking | Two to three years of weekly spend and outcome data | A cell you can withhold spend from |
| Specialist skill | Analytics engineer | Bayesian modeler or an agency | Someone who can run a power analysis |
| Direct financial cost | Low | Modeling time, or an agency retainer | Forgone revenue in the holdout, for the length of the test |
| Refresh cadence I would plan for | Continuous | Quarterly | Two to four tests a year, one channel at a time |
The refresh cadence row is my planning assumption rather than a published benchmark, and the incrementality column is the one teams underestimate.
Randall Lewis and Justin Rao put a number on the statistical cost in the Quarterly Journal of Economics. Across 25 large field experiments with US retailers and brokerages representing $2.8 million of digital advertising spend, they found “the median confidence interval on return on investment is over 100 percentage points wide”, and concluded that informative advertising experiments “can easily require more than 10 million person-weeks, making experiments costly and potentially infeasible for many firms” (The Unfavorable Economics of Measuring the Returns to Advertising, 2015).
Ad platforms now surface a version of that math up front. Google’s Conversion Lift based on geography setup assigns a feasibility status before you launch: “There are 3 levels of feasibility status: High, Medium, Low”, with the guidance that “‘High’ feasibility status will give you the best chance at generating statistically significant results” and “We don’t recommend proceeding with low feasibility status”. I would not launch anything rated Medium either. A Medium test that returns inconclusive has cost you a live holdout, a month of calendar and the political capital you spent getting the holdout approved, and it leaves you exactly where you started.
Meta’s GeoLift documentation sets the duration rule that matters: “a good rule of thumb when deciding duration is to make sure that the test period can contain at least one full purchase cycle”, and it treats a prospective power analysis as a prerequisite rather than a nice-to-have.
Conditions Under Which Each Method Lies
Every method has a list of situations where its answer is wrong in a known direction. Checking your situation against the list before you read the number is cheaper than arguing about the number afterwards.
Attribution gives a wrong answer when:
- The channel is targeted at people who already showed intent, which is the brand-search case at the top of this post
- The buying cycle exceeds your lookback window, so early touchpoints are dropped rather than discounted
- The channel produces no click, so it never appears in a path at all
- You compare two channels measured under different platform windows and treat the comparison as fair
Marketing mix modeling gives a wrong answer when:
- Spend on a channel barely moved across the modeled period, leaving no variation to identify an effect
- Spend rises alongside a confounder the model does not control for, such as a product launch, a price change or a seasonal demand peak
- The model is over-parameterized relative to the data, the exact failure Meridian’s documentation warns about at four data points per parameter
- The channel is small relative to total revenue, so its true effect sits inside the noise
Incrementality gives a wrong answer when:
- The cell is too small to detect the effect size you care about, which produces a confident point estimate with a useless interval
- Treatment spills across the holdout boundary, which happens whenever a national channel runs on top of a geo test
- The window closes before lagged effects land, which understates any channel with a long consideration period
- You generalize a result from one budget level to a different one. A holdout run at a $40,000 monthly budget says nothing about the marginal return at $400,000, because saturation curves bend
- The test ran during an unrepresentative period, such as your peak promotional week
The eBay paper carries the first failure on that attribution list and a second one that a channel average would bury. Its non-brand test used a different design from the brand test: bidding was stopped on all non-brand keywords for 60 days in 68 test DMAs, measured against 142 control DMAs. Inside that test, “new and infrequent users are positively influenced by ads” while “more frequent users whose purchasing behavior is not influenced by ads account for most of the advertising expenses, resulting in average returns that are negative”. One blended channel-level number hid two opposite effects.
Marketing Mix Modeling vs Attribution: The Decision Rule
The choice is determined by four things you either have or do not have: the ability to withhold spend, the length of your data history, the length of your sales cycle, and whether the channel is measurable at user level at all.
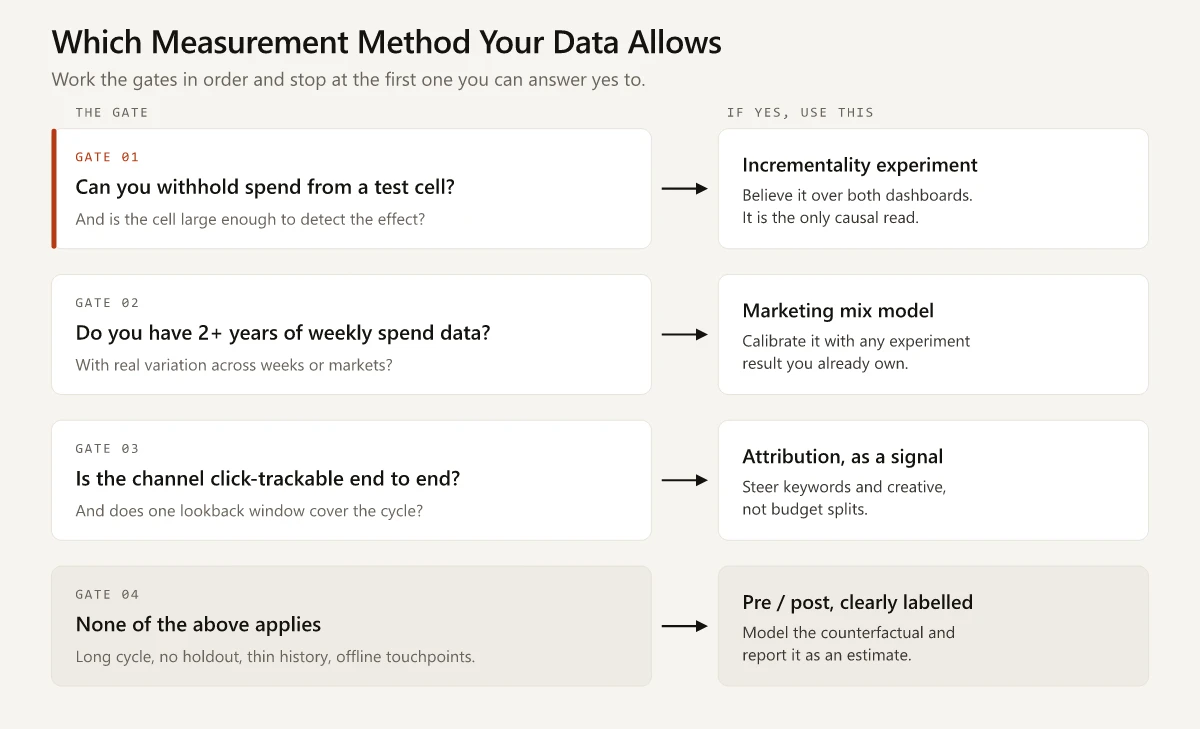
Work the gates in this order.
- Can you withhold this spend from a randomized cell, and is that cell large enough to detect the effect you expect? If yes, run the experiment. Its answer beats both dashboards, because it is the only one that observed the counterfactual. The power analysis comes before the launch date, not after the inconclusive result.
- Do you have two or more years of weekly spend and outcome data, with real variation in that spend across weeks or markets? If yes, build or buy a mix model and calibrate it against any experiment result you already own. If your spend has been flat across every week and market, that is a demand generation planning problem before it is a measurement one, and no model will manufacture the variation.
- Is the channel click-trackable end to end, and does one lookback window cover your sales cycle? If yes, attribution is a fair directional signal for decisions inside that channel. Use it to choose keywords and creatives, not to split budget across channels.
- None of the above? Do not publish a single number. Run a pre/post comparison with a modeled counterfactual and label the output an estimate. Google’s CausalImpact fits a Bayesian structural time-series model for this, and its documentation is explicit that the method assumes “the relationship between covariates and treated time series, as established during the pre-period, remains stable throughout the post-period”. Say that assumption out loud when you present the result.
The first gate is the hardest to clear, because withholding spend feels like deliberately losing money. It is, for the duration of the test. The alternative is funding a channel indefinitely on evidence that randomized experiments have repeatedly shown to be inflated.
How to Run Incrementality Experiments You Can Trust
Incrementality experiments fail on design more often than on execution. Six decisions do most of the work.
- Test one channel at a time. A test that turns off three channels at once tells you their combined effect and nothing about how to reallocate between them.
- Choose the randomization unit before the channel. If the media can be bought by geography, randomize geographies. If it is a CRM-driven channel like email or a retargeting audience you control, randomize users. If neither, you are looking at a time-based on/off design, which is the weakest of the three.
- Run the power analysis first and let it set the cell size and duration. Both Google’s feasibility rating and GeoLift’s prospective power analysis exist to stop you launching a test that cannot resolve.
- Set the window to at least one full purchase cycle, per GeoLift’s rule, and add the lag you expect between exposure and conversion.
- Pre-register the primary metric and the decision it will drive. Write down, before launch, what result increases the budget and what result cuts it. A test without a pre-committed decision becomes a debate about methodology the moment the answer is unwelcome.
- Hold everything else constant. New creative, a pricing change or a launch inside the test window turns your clean comparison into a confound you cannot unwind.
Then feed the result forward rather than filing it. The point of a hard-won experimental number is that it constrains everything you measure afterwards.
One Measurement Stack, Three Layers of Evidence
The three methods work as a stack, and the dependency runs in one direction. An experiment result is worth more inside the mix model than it is in a slide of its own, because the model can carry that single measured number across the channels and weeks you will never be able to test directly.
Google built that dependency into Meridian. The launch post states that “Meridian easily integrates incrementality experiment results as priors” so that “your model can be calibrated with real-world results, for more accurate outcomes”. The method behind it is set out in Media Mix Model Calibration With Bayesian Priors by Zhang and colleagues at Google (2024), which reparameterizes the regression in terms of ROAS specifically so that priors from previous experiments can be applied directly. The Meridian repository describes the same capability: it “provides methodologies to support calibration of MMM with experiments and other prior information”.
Calibrating on an experiment replaces the model’s assumed effect size for that channel with a measured one. Every other channel in the model stays correlational, which is why the list of channels you have tested matters as much as the model specification.
The reporting split I would run:
| Cadence | What you report | What it decides |
|---|---|---|
| Daily and weekly | Attribution and platform metrics | Keywords, creative, audiences, budget pacing inside a channel |
| Per test, a few times a year | Incrementality results | Whether a channel or a budget level stays funded |
| Quarterly | Mix model, calibrated on the latest experiments | Budget allocation across channels for the next quarter |
Keeping those on separate slides stops the quarterly argument about which number is correct, because the three are never answering the same question at the same altitude. The same discipline applies to the wider set of product marketing metrics you take into a leadership review: label what each number is evidence of.
Brand measures belong on a fourth line with a much longer clock. All three methods here attribute revenue to spend; none of them tells you whether you are being heard more than the competitor you are losing to. That is the share of voice vs market share question, and the share of voice calculator computes it, including the excess-share-of-voice gap.
Which Method Should You Believe When They Disagree?
Believe the one with a control group. Ranked by how much weight I would put on a conflicting answer:
- A properly powered incrementality experiment on the specific spend in question, run for at least one purchase cycle
- A mix model calibrated with experimental priors, which inherits some of that causal grounding
- An uncalibrated mix model, which is a correlational estimate with explicit assumptions you can inspect
- Data-driven attribution, which weights touchpoints using observed conversion paths and never sees an unexposed group
- Last-click attribution, which is a convention, useful for consistency and nothing else
The ranking is not about sophistication. Double/debiased machine learning is a more advanced technique than a geo holdout, and the Gordon, Moakler and Zettelmeyer results show it still missed the experimental answer at all three funnel stages. What moves an estimate up this list is proximity to an observed counterfactual.
One practical consequence: when attribution and an experiment disagree about a channel, do not average them. Averaging a causal estimate with a descriptive one produces a number that answers no question at all. Take the experimental estimate, and use attribution to decide what to change inside whatever budget survives.
The First Budget Line to Test
The marketing mix modeling vs attribution debate resolves the moment you write down which question you are asking, because each method is the right answer to exactly one of them. Attribution tells you what to change inside a channel. A mix model tells you how to split money across channels. An experiment tells you whether the money should exist. Teams that keep arguing are asking a causal question of a descriptive tool and then blaming the tool.
Pick the largest budget line nobody has ever tested. Brand search is the usual candidate, and eBay’s brand-keyword result is a reasonable prior for what you will find. Work out what you can withhold it from: a set of geographies if the media can be bought that way, or one search engine while another keeps running, which is the split eBay used. Run the feasibility or power analysis, and put the launch date in the calendar. If you cannot withhold it anywhere, that fact is itself the finding, and it tells you which of the other two methods you are stuck with.
Start with the holdout you have been avoiding.
Frequently Asked Questions
What is the difference between incrementality and attribution?
Attribution splits credit for a conversion among the touchpoints that were recorded before it. Incrementality compares a group exposed to the spend against a randomized group that was not, so it estimates what would have happened if you had never run the campaign. Attribution describes observed paths; incrementality estimates a counterfactual. Only the second one answers a causal question.
How do you define incrementality in marketing?
Incrementality is the share of an outcome that would not have occurred without the marketing spend. It is a property of the spend, not a report you can pull. You estimate it by withholding the spend from a randomized set of users, geographies or time periods and measuring the difference in outcomes between the exposed and withheld groups.
Is incrementality testing the same as A/B testing?
No. A standard A/B test compares two versions of something that both run, such as two landing pages or two subject lines. An incrementality test compares running the spend against not running it at all, so the control group sees nothing. That changes the randomization unit, usually to geography or user cohort, and it means the control group costs you real revenue while the test is live.
What is the difference between lift and incrementality?
Incrementality is the underlying effect; lift is the number a specific test reports. Google Ads alone offers several kinds of lift that measure different outcomes: Brand Lift measures survey metrics like ad recall, Search Lift measures search queries, and Conversion Lift measures conversions. A brand lift result is not evidence of incremental revenue, so always check which outcome a lift figure refers to.
Can marketing mix modeling replace attribution?
Not entirely. Marketing mix modeling works on aggregated weekly data and answers budget-allocation questions across channels, including offline media that attribution cannot see. It cannot tell you which keyword, creative or audience to change, because the model has no user-level records. Attribution handles in-channel optimization and a mix model handles cross-channel budget decisions, so a team running both needs both.