Share of Voice vs Market Share: ESOV Without Ad Spend
Share of voice vs market share are a leading and lagging pair. Six substitute voice proxies for categories with no ad-spend denominator, and a worked count.

Share of voice has one canonical formula, and for an entire class of companies it returns nothing. Every comparison of share of voice vs market share starts by dividing your category advertising spend by total category advertising spend. Nielsen Ad Intel, one of the syndicated panels that sells that denominator, describes its coverage as “TV, CTV, digital, social, audio, print, out of home, and cinema” across “90+ international and 29+ local markets” (Nielsen). The biggest line items in a developer-tools budget are conference sponsorship, documentation, developer relations headcount and open-source maintenance, and none of those is a placement in any of those channels. They do not enter the panel, so neither your numerator nor the category’s denominator is in there to divide.
So teams substitute. They swap mentions, rankings or citations in for spend, run the same formula, and keep the growth rule that was fitted on spend. That substitution is the whole problem, and it happens in public: Talkwalker’s guide publishes the formula as “(Brand Mentions / Total Mentions in Category) x 100 = SOV%”, then states two paragraphs later that “market share typically gains 0.5% for every 10% in excess share of voice (ESOV)” (Talkwalker). The formula counts mentions. The 0.5 was fitted on advertising spend. Nothing on the page connects the two.
My position: share of voice and market share are one competitive position observed at two points in time, and treating them as a leading and lagging pair is the only reading that survives in a category where no auditor publishes either total. Below are the four published denominators that disagree with each other, six voice proxies worth substituting with the specific way each one lies, a worked count on a real category where three counters disagree by 8.6 points, and what the growth constant actually says once you find the study it came from.
Bring your own counts. The free share of voice calculator runs the arithmetic below on your numbers: shares for you and up to five competitors, your excess share of voice, and each published growth constant with its scope attached.
What Is the Difference Between Share of Voice and Market Share?
Share of voice is your brand’s portion of the total attention in a category, measured across advertising spend, media mentions or search visibility. Market share is your portion of the category’s actual revenue or units. Voice is an input that moves first; share is an outcome that moves later, which is why comparing them in the same quarter misreads both.
| Share of voice | Market share | |
|---|---|---|
| What it counts | Attention: spend, mentions, impressions, citations | Money or units transacted |
| Denominator | Category total for the same attention metric | Category revenue or unit volume |
| Who publishes the denominator | A media auditor, a listening tool, or you | An analyst firm, a regulator, or nobody |
| Type of measure | Input, controllable this quarter | Outcome, settled by contracts already signed |
| How fast it moves | Weeks | Renewal cycles |
| Main failure mode | The denominator is editable by whoever picks the metric | The denominator may not be published at all |
The row that does the damage is the one about who publishes the denominator. In fast-moving consumer goods both denominators are audited by a third party, so the two numbers are commensurable. In privately held B2B software neither is, which means both halves of the comparison are estimates produced by the party being measured.
The Share of Voice Formula Has More Than One Denominator
Four of the pages I checked publish a share of voice formula. They disagree about what goes in the bottom of the fraction, and one of them has no category denominator at all.
| Publisher | What the published formula divides by | What that measures |
|---|---|---|
| Binet and Field via LinkedIn | Total category advertising spend | Paid media weight |
| Talkwalker | ”Total Mentions in Category”: brand mentions divided by category mentions, times 100 | Volume of online conversation |
| Sprout Social | ”Total market metrics” for the same data points across competitors | Whatever metric you chose, across a competitor set you chose |
| Google Ads search top impression share | ”the estimated number of impressions you were eligible to receive among top ads” | Your own auction eligibility, not the category |
The Google row is the one with no category in it. Google defines search top impression share as impressions received among top ads divided by “the estimated number of impressions you were eligible to receive among top ads”. Your eligibility is set by your budget, targeting and quality score, so the denominator moves when you change your own settings and stays put when a competitor triples their spend. That metric has the word share in it and no rival in it.
Sprout Social does flag the ambiguity, noting that while share of voice sometimes refers to a brand’s share of paid advertising, “it also has a broader definition that can include various elements of digital marketing and advertising, including mentions on social media and traffic for certain keywords”. Sprout stops there and never mentions ESOV or the growth constant, so its formula and its claims stay on the same metric. Talkwalker is the page where the two halves meet without being reconciled: a mentions formula at the top, and the spend-fitted 0.5 constant applied to it further down, credited to “Researchers Binet and Field” who “studied 171 campaigns”.
That is the same failure mode as running two measurement systems on one budget and reading whichever agrees with you, which I go through in the breakdown of marketing mix modeling versus attribution versus incrementality. A metric is only comparable to a benchmark computed the same way.
Share of Voice Proxies When the Category Buys No Category Ads
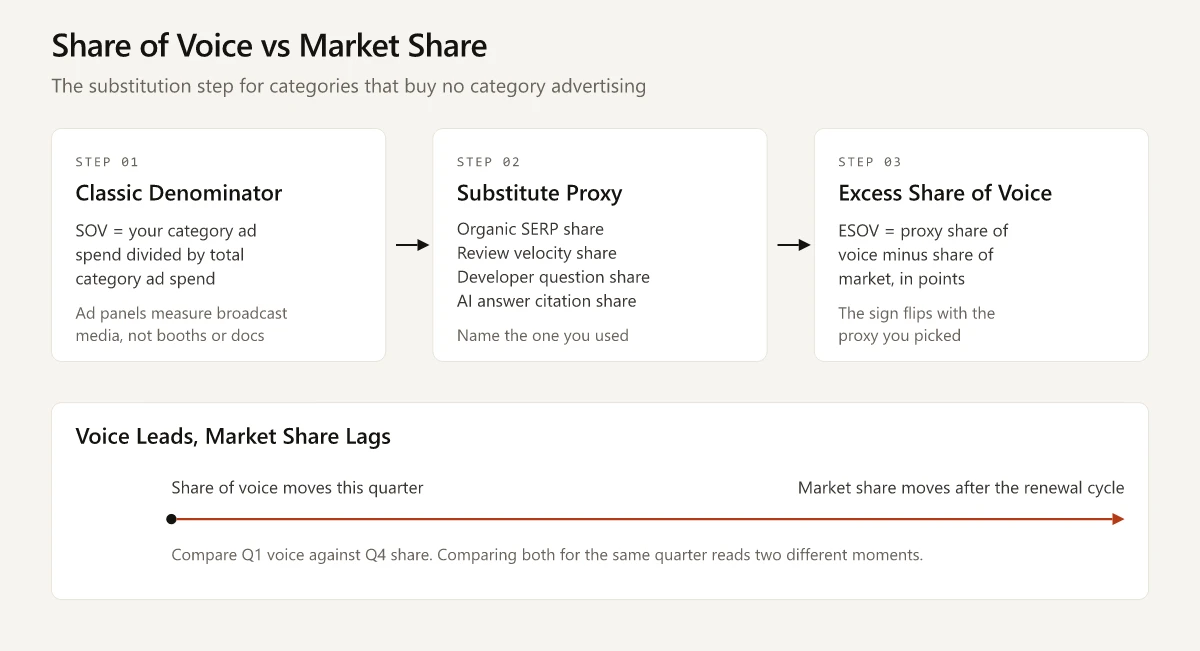
Substituting a proxy is the correct response to a denominator you cannot compute. Choosing one without labelling it on the chart is not. Six proxies that a B2B software or developer tools team can actually build, with how each is computed and the specific way each one lies:
| Voice proxy | How you compute it | Best for | Where it breaks |
|---|---|---|---|
| Organic SERP share | Sum estimated organic traffic or weighted rank positions for your domain across a fixed keyword set, divide by the same sum for the full competitor set | Categories where buyers research by searching problems, which covers most technical purchases | You choose the keyword set, so the denominator is editable. Swapping ten keywords moves the number more than a quarter of publishing will. Documentation pages and marketing pages score identically |
| Review velocity share | Count new reviews per quarter per vendor on G2 or Capterra, divide by the category total for the same quarter | Categories with an established review-site page and real buyer traffic to it | Review volume is purchasable through gift-card campaigns, so this often measures incentive budget rather than attention. The review site, not you, decides who belongs in the category |
| Developer question share | Count posts tagged with or mentioning each vendor on Stack Overflow or a comparable forum, divide by the category total | Developer tools where adoption produces public troubleshooting | Tags accrete historically, so a tag opened in 2013 carries years of posts a 2019 tag cannot. Full-text search returns answers as well as questions, so the unit shifts under you. Better documentation produces fewer questions, so product quality and silence look identical |
| Package and repository signal share | Compare npm, PyPI or Maven download counts for each vendor’s SDK, or GitHub stars and public-repo mentions | Categories distributed as a library or CLI | CI re-installs dominate download counts, so the number tracks build frequency. The packages are rarely functional equivalents, and stars are a lifetime total rather than a rate |
| Conference and sponsorship slot share | Fix a list of category events for the year, count sponsor tiers and accepted talks per vendor, weight by tier, divide by the total | Categories where buying committees still meet in rooms | The organiser caps the slots, so your ceiling is set by someone else’s inventory rather than your budget. A keynote and a booth are not one unit each |
| AI answer citation share | Run a fixed prompt set against each answer engine on a schedule, count which domains get cited, divide by total citations | Categories where evaluation now starts inside a chat window | The answers are non-deterministic, so the same prompt returns different citations on consecutive runs. The prompt set is yours, which makes the denominator editable again, and region and personalization shift results |
The last row connects to work I have already written up: earning the citation is a different discipline from earning the ranking, which is the subject of the LLM optimization breakdown and, on the measurement side, the practical routes to improving brand visibility in AI search engines.
Two rules cover all six. The competitor set has to be fixed in advance and written down, because adding or dropping one vendor changes every share in the table. And the proxy has to be named next to the number every time, because “38% share of voice” with no metric attached is not a measurement.
How to Calculate Share of Voice From Public Data
Here is the substitution run on a real category with real public numbers, and it comes apart in a way worth seeing.
The category is cloud cross-browser testing. The vendors are BrowserStack, Sauce Labs and LambdaTest, which is the category I work in as a product marketer at LambdaTest. The voice proxy is developer question share on Stack Overflow, chosen because anyone can re-run it: every figure below comes from the public Stack Exchange API, captured 12 September 2026, with no key and no account. The literal query strings are printed in each table so you get the same numbers I did.
The first counter is the vendor tag. Call api.stackexchange.com/2.3/tags/{tag}/info?site=stackoverflow and read the count field.
| Vendor | Tag queried | Tagged questions | Share of the three |
|---|---|---|---|
| BrowserStack | browserstack | 718 | 57.5% |
| Sauce Labs | saucelabs | 517 | 41.4% |
| LambdaTest | lambdatest | 13 | 1.0% |
| Total | 1,248 | 100% |
The second counter is full-text search. Call api.stackexchange.com/2.3/search/excerpts?q={term}&site=stackoverflow&filter=total and read the total field. This endpoint searches posts rather than questions, so the count includes answers: an unfiltered page of 30 results for q=lambdatest came back as 20 questions and 10 answers.
| Vendor | Query | Posts mentioning the vendor | Share of the three |
|---|---|---|---|
| BrowserStack | q=browserstack | 2,802 | 59.9% |
| Sauce Labs | q=saucelabs | 1,657 | 35.4% |
| LambdaTest | q=lambdatest | 218 | 4.7% |
| Total | 4,677 | 100% |
The third counter restricts the same search to questions. Call api.stackexchange.com/2.3/search/advanced?q={term}&site=stackoverflow&filter=total with the identical terms.
| Vendor | Query | Questions mentioning the vendor | Share of the three |
|---|---|---|---|
| BrowserStack | q=browserstack | 1,453 | 61.8% |
| Sauce Labs | q=saucelabs | 772 | 32.9% |
| LambdaTest | q=lambdatest | 125 | 5.3% |
| Total | 2,350 | 100% |
One query detail decides a large part of that table. Sauce Labs is two words, and the vendor’s Stack Overflow tag is one token, saucelabs. Searching the spaced form instead returns 716 posts and 398 questions rather than 1,657 and 772, because the API treats it as two separate terms. Getting a brand’s token spelling wrong cuts its measured voice by more than half before any competitor does anything, which is the reason to publish the query string and not the vendor name.
All three tables are correct arithmetic on correctly fetched public numbers, and they disagree. LambdaTest’s share of voice is 1.0% on the tag counter, 4.7% on the post counter and 5.3% on the question counter, a factor of about five across the range, while Sauce Labs falls from 41.4% to 32.9% over the same three, a swing of 8.6 percentage points. Nothing about the market changed between the queries. The tag counter undercounts any vendor whose users tag by framework rather than by platform, and the two full-text counters pick up comparison threads where a vendor is named but never used.
| Vendor | Tag counter | Post counter | Question counter | Spread across the three |
|---|---|---|---|---|
| BrowserStack | 57.5% | 59.9% | 61.8% | 4.3pp |
| Sauce Labs | 41.4% | 35.4% | 32.9% | 8.6pp |
| LambdaTest | 1.0% | 4.7% | 5.3% | 4.3pp |
Now try to finish the ESOV calculation, which needs share of voice minus share of market. The next input is each vendor’s share of cloud testing revenue. None of the three is a listed company, so no filed revenue figure exists for any of them, and no regulator publishes unit volumes for this category. The denominator on the second half of the equation is missing for the same structural reason the advertising denominator was missing on the first half, which means no vendor in this table has a knowable ESOV at all.
That is the honest outcome, and it is more useful than a clean number would have been. Sizing a category with no published denominator is the same problem I work through in top-down versus bottom-up market sizing, and the answer is the same: build the estimate from units you can count, and publish the method next to the result.
What Is Excess Share of Voice?
Excess share of voice is share of voice minus share of market, in percentage points. LinkedIn’s marketing blog states the definition plainly: a brand has extra or excess share of voice “when its Share of Voice exceeds its Share of Market”, and the worked illustration is a brand generating 10% of category sales while owning 15% of share of voice, for an ESOV of plus 5 (LinkedIn for Marketing, July 2025, bylined to Tequia Burt).
The rule attached to it is that positive ESOV predicts market share growth at a fixed rate per point. That rate is the figure I see quoted most often without a source attached, and it is not one number.
| Source page | Published constant | Scope the page itself states |
|---|---|---|
| Nielsen, Budgeting for the Upturn (Aug 2009) | “a 10 point difference between SOV and SOM leads to 0.5% of extra market share growth” | 123 brands across 30 categories of “‘typical’ advertising”; the norm is offered “when setting targets for fast moving consumer goods (FMCG) brands” |
| LinkedIn, The B2B Marketer’s Guide to the Share of Voice Rule (17 Jan 2020) | “an ESOV of 10% leads to market share growth of 0.7% per year” | B2B |
| The same 2020 page | ”10% ESOV drives 0.6% annual growth” | B2C |
| LinkedIn, Share of Voice and ESoV (11 Jul 2025) | “for every ten positive ‘points’ of ESoV, a brand will gain 0.5% market share” | A B2B article, but the sentence carries no qualifier and links out to the Nielsen FMCG page above |
Three constants, and the spread is not academic. A B2B team holding 8 points of ESOV forecasts 0.4pp of annual share growth under the 0.5 figure and 0.56pp under the 0.7 one, a 40% difference in the forecast before anybody argues about the inputs. Pick the wrong row and you have imported a consumer packaged goods norm into a software plan.
The 0.5 Traces to an FMCG Study
The 0.5 has a primary source, and it is specific about its own limits. Nielsen’s 2009 analysis covered 123 brands across 30 categories of “‘typical’ advertising (i.e., not award-winning campaigns)”, recommends the 10-to-0.5 ratio “when setting targets for fast moving consumer goods (FMCG) brands”, and adds that “there were large variances across particular categories and brands; therefore, a brand should measure its specific relationship between SOV and SOM to provide an accurate benchmark”. That is a consumer-goods norm with a caveat attached, and both LinkedIn’s 2025 B2B article and Talkwalker’s social listening guide reprint the number without the caveat.
The 0.6 and 0.7 come from a different corpus. The 2020 LinkedIn page says its “joint report with Les Binet and Peter Field analyzed effectiveness data from the Institute of Practitioners of Advertising databank”, and the IPA’s own Five Principles of Growth in B2B Marketing page describes a report “written by EffWeek contributors, Peter Field and Les Binet, and launched by the B2B Institute, a think tank funded by LinkedIn”, naming “Invest in share of voice” among its five principles. The IPA’s Binet and Field page lists The Long and The Short of It (November 2013), Media in Focus (October 2017) and Effectiveness in Context (October 2018), each built on the IPA Effectiveness Databank.
Two properties of that provenance change how much weight the constant carries.
- The measured input was paid media spend in both corpora. Nielsen measured advertising, and the IPA databank holds campaign entries and their media investment, so every published version of the constant is fitted on spend share rather than on mention share, citation share or search share.
- The lineage is short and self-referential. The 2020 page credits the rule’s clearest statement to “a 1990 article in Harvard Business Review by John Phillip Jones” and says it is “backed by additional research from The Ehrenberg-Bass Institute and researchers Les Binet and Peter Field”, so the idea is not LinkedIn’s invention. What none of these pages carries is a re-fit of the constant on a dataset outside the Nielsen study or the IPA databank, which is why the B2B figure and the FMCG figure never get reconciled with each other.
None of that makes the rule useless. It makes it a rule about advertising spend share in measured categories, carrying an effect size stated three ways by three different scopes. Anyone applying it to a mention count is extrapolating, and the honest move is to say so on the slide.
Share of Voice vs Market Share Move on Different Clocks
Comparing this quarter’s voice to this quarter’s share is a category error, because the second number was determined by contracts signed before the first number moved. The chain has fixed gates, and each one clears before the next can.
| Stage | What has to happen | Can it move within a quarter? |
|---|---|---|
| Proxy voice share | You publish, sponsor, rank or get cited | Yes, within weeks |
| Branded search volume | Someone remembers the name well enough to type it | Partly, and it is observable in Search Console and Google Trends |
| Inbound qualified pipeline | A buyer enters an active evaluation | Only for the small fraction currently in market |
| Won revenue | A contract is signed and countersigned | Only after a full sales cycle, which in B2B software usually runs longer than one quarter |
| Category share | Enough contracts move across enough of the category | Only across renewal cycles |
The third row sets the pace for everything under it. Research by Professor John Dawes for the LinkedIn B2B Institute, summarised on the Ehrenberg-Bass Institute’s own site, found that companies change providers of services such as banking, legal advice, software or telecoms roughly every five years, so “only 20% are in the market for those services in a given year and just 5% in a given quarter” (Ehrenberg-Bass Institute). Voice reaching the other 95% cannot convert into share this quarter, because those accounts have nothing to buy.
Sprout Social’s guide concedes the timing directly, describing a high share of voice as “a leading indicator” that builds the recognition driving future market share growth. That framing is right, and it carries a consequence its own dashboards do not enforce: a leading indicator is evidence only if you record the lag and check back after it has run.
The practical version is to date-stamp the pair. Record voice for Q1 and compare it against share for Q4, not against share for Q1. Keeping input and outcome metrics on separate clocks is the same discipline I apply to content measurement in how to measure SaaS content marketing.
Reporting Share of Voice vs Market Share Without Overclaiming
Five rules keep the pair reportable when neither denominator is audited.
- Name the proxy in the metric label. “Share of voice” is not a metric. “Stack Overflow question-mention share across three named vendors” is.
- Publish the query, not the vendor name.
q=saucelabsandq=sauce labsreturn 1,657 and 716 on the same endpoint on the same day. The string is part of the method. - Publish the raw counts beside the percentage. 125 out of 2,350 survives an audit six weeks later; 5.3% does not.
- Quote the ESOV constant with its source and its scope. If you use 0.5, say it comes from Nielsen’s FMCG analysis; if you use 0.7, cite the LinkedIn page that publishes it and label it the B2B figure.
- Offset the comparison by your sales cycle. Voice from the quarter that ended before your average cycle length, against share for the quarter just closed.
Freezing the competitor set is where most of this work lives, and it is a research task rather than a reporting one. The method for building and holding that set is in my walkthrough of competitive intelligence analysis.
The ESOV Rule Does Not Promise Growth
What the ESOV rule says is that, in measured consumer and B2B advertising categories, brands buying more media weight than their sales share grew on average across the campaigns that Nielsen and the IPA databank captured. It does not promise that your mention share behaves like media weight, that your category has a measurable size, or that the effect arrives inside your reporting year. The constant sits at 0.5 for consumer goods, 0.6 for B2C advertising and 0.7 for B2B, depending on which corpus you are quoting.
The version of share of voice vs market share I would defend is the narrow one. Pick one voice proxy, publish the query that produced it, freeze the competitor set, keep the raw counts next to the percentage, and read it against a share figure from an earlier quarter. That gives you a leading indicator with a stated lag, which is a real instrument. The alternative gives you a percentage whose denominator nobody can rebuild, including you, six weeks later when someone asks.
Run it on your own numbers. The share of voice calculator takes your counts and your market share, returns the shares and your excess share of voice, and prints each growth constant beside the scope it was fitted on. Nothing is sent anywhere.
Frequently Asked Questions
What is excess share of voice?
Excess share of voice, or ESOV, is share of voice minus share of market, expressed in percentage points. A brand with 15% share of voice and 10% share of market has an ESOV of plus 5. LinkedIn's marketing blog describes positive ESOV as a predictor of market share growth, using a constant published at 0.5, 0.6 and 0.7 depending on the page and the audience it addresses.
How do you calculate share of voice?
Divide your brand's volume of a chosen voice metric by the category total for the same metric over the same window, then multiply by 100. The original definition uses category advertising spend. Social listening tools substitute brand mentions and search tools substitute organic visibility, which produce different numbers on the same brand in the same week.
What is the difference between market share and share of voice?
Market share is your portion of the category's revenue or units, which is an outcome. Share of voice is your portion of the category's attention, which is an input. They describe the same competitive position at two different points in time, so they are a leading and lagging pair rather than two metrics to rank against each other.
How is share of voice measured in B2B software?
Usually by substitution, because syndicated ad-spend panels measure broadcast and published media rather than conference sponsorship, documentation or open-source work. Teams swap in organic search visibility across a fixed keyword set, review velocity on G2 or Capterra, developer question volume, sponsorship slots, or AI-answer citation counts. Each substitution changes what the ESOV rule is predicting.
Is share of voice a leading indicator of market share?
It is treated as one, including by Sprout Social, whose share of voice guide calls a high share of voice a leading indicator. The lag matters: in B2B software a contract has to come up for renewal before category share can move, so voice measured this quarter cannot be checked against share measured this quarter.