Developer Experience Survey: Questions and Design Rules
A developer experience survey is only as good as its instrument. A copy-ready question bank, the limits on length and cadence, and how to segment results.
Take stock of what is on the shelf when you sit down to build a developer experience survey.
- SPACE (Forsgren, Storey, Maddila, Zimmermann, Houck and Butler, ACM Queue, March 2021) gives five dimensions, example metrics for each, and a rule for how many to pick.
- DevEx (Noda, Storey, Forsgren and Greiler, ACM Queue, May 2023) gives three dimensions, a split between perceptual and workflow measures, and several pages of survey guidance.
- Michaela Greiler, a co-author of the DevEx paper, publishes example item wordings free and ungated, grouped by flow state, feedback loops and cognitive load, plus a set reproduced from Atlassian.
- The DevEx Metrics Compass (Meyer, Meyer, Murphy and Fritz, 2026) catalogues developer experience metrics drawn from research and the public practices of more than 50 engineering organizations, and tags each one as automated or self-reported.
- The DORA Quick Check is five multiple-choice questions that take under a minute and report software delivery performance.
- The Stack Overflow Developer Survey ran 62 questions and over 49,000 responses in 2025. It benchmarks the profession, not your engineering org.
- DX publishes a survey guide behind a work-email form; the fielded instrument itself is the product it sells.
Between them those give you dimensions, example wordings and a metrics catalogue. This post is the assembled instrument: every item with the scale that fits it, which items run every round and which rotate, the length limit, the cadence, and the segmentation floor that decides whether a six-person team shows up at all.
Every rule below is labeled either as published research with a link, or as my design judgment. I work in product marketing at a developer testing platform, so the reading of the frameworks is informed, but the thresholds I set are mine and I have marked them as such.
What a Developer Experience Survey Measures That DORA and SPACE Do Not
The three names get used as if they were alternatives. They sit at different layers, and choosing the wrong one is how a program ends up reporting deployment frequency to a room that asked why senior engineers are leaving.
| Artifact | What it is | What it measures | Fieldable as a survey? |
|---|---|---|---|
| DORA’s five metrics | A set of software delivery performance measures | The outcomes of the software delivery process: change lead time, deployment frequency, failed deployment recovery time, change fail rate, deployment rework rate | No. It is a metric set, though DORA publishes a five-question self-assessment |
| SPACE | A multidimensional framework for developer productivity | Satisfaction and well-being, performance, activity, communication and collaboration, efficiency and flow | No. It tells you how to choose metrics, not what to ask |
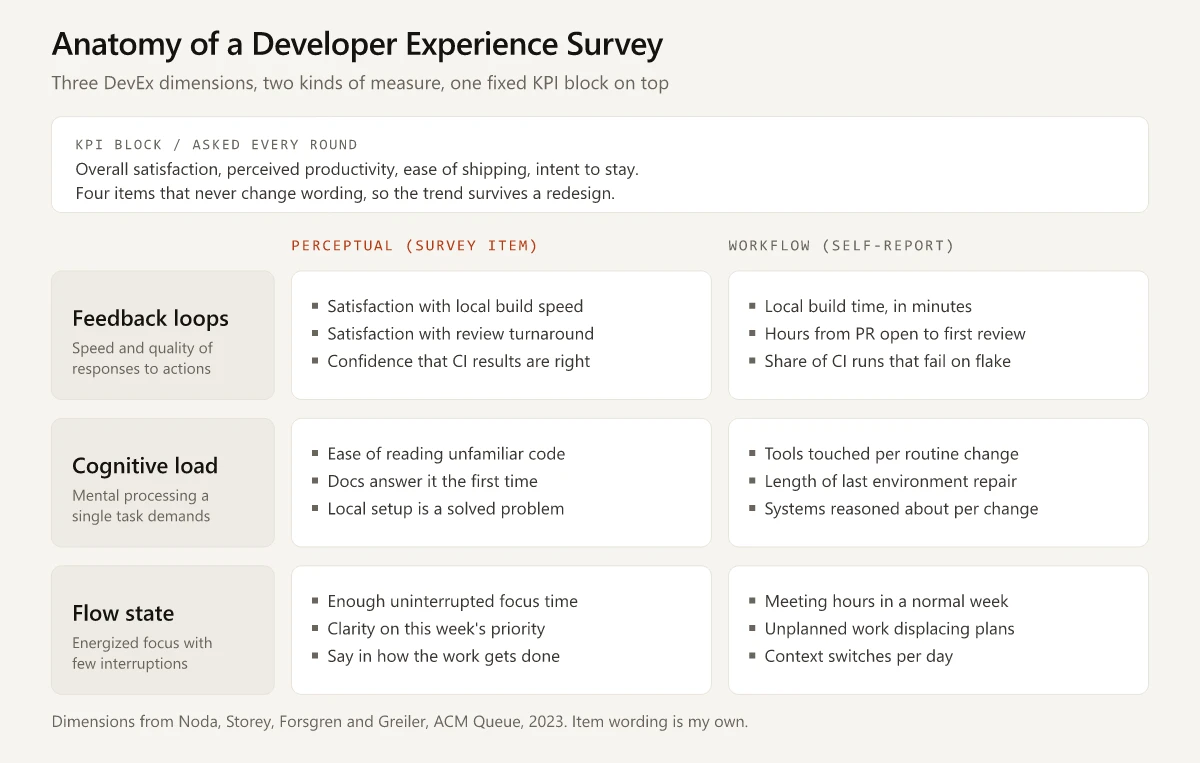
| DevEx | A framework plus a measurement model | Feedback loops, cognitive load, flow state, captured as perceptions, workflows and KPIs | Closest. It specifies the measurement classes; the item wording is left to you |
| A DevEx survey | An instrument | Developers’ self-reported experience of the above, by team and role | Yes. This post |
DORA’s own guide now lists five software delivery performance metrics, not four. The page describes the metrics as having “evolved alongside the technology landscape: shifting from the original four keys to the current five-metric model”, with deployment rework rate added and failed deployment recovery time replacing MTTR. Anyone still writing “the four keys” is citing a version DORA has moved on from.
SPACE is a selection rule rather than a questionnaire. Its guidance is to capture several metrics across multiple dimensions, “at least three are recommended”, and it adds that “at least one of the metrics include perceptual measures such as survey data”. That is a recommendation, and survey data is the example it names rather than the only thing that satisfies it, so interviews or diary studies would also clear it. What it does not clear is a dashboard assembled only from system telemetry.
Writing up the DevEx Metrics Compass, Andre Meyer gives the working reason for keeping the self-reported half: “Logs and telemetry track trends well, but rarely explain why a metric changed.”
For the wider question of which numbers survive a quarterly review at all, the trade-offs are the same ones covered in product marketing metrics.
Perceptual Measures and Workflow Measures Are Not Interchangeable
The DevEx paper is explicit that you need both, and gives the reason in a single example: “seemingly fast code review turnaround times may still feel disruptive to developers if code reviews regularly interrupt their work progress.” The counter-case sits in the same paragraph, where developers feel content with a build process that objective timing shows to be slower than it could be.
That is why a satisfaction question and a friction question are different instruments pointed at different things.
- A satisfaction item measures the gap between expectation and reality. A developer who has spent two years planning around an eleven-minute build can report high satisfaction with it, because the workaround has become invisible to them.
- A friction item measures the cost of the workaround. It asks how often the thing happens, how long it takes, or how many systems it touches, and it does not care whether the person has made peace with it.
Ask only the first and you will renew the budget on a system nobody has the energy to complain about any more. Ask only the second and you will optimize a build time that was never the problem.
Seven Design Rules for a Developer Experience Survey
These are the rules I would defend in a design review.
| # | Rule | The threshold | Where it comes from |
|---|---|---|---|
| 1 | Cap the periodic instrument | About 22 scored items, under eight minutes | My design judgment |
| 2 | Field quarterly or semi-annually | Optimal for most orgs; more often only with a stated reason | DevEx paper: “a quarterly or semi-annual survey cadence is optimal for most organizations”, though “for some, benefits may accrue from administering surveys more frequently” |
| 3 | Segment before you field | Team, role, tenure, and one stack dimension | DevEx paper: break down results by team and persona rather than companywide |
| 4 | Keep a fixed KPI block | 4 items that never change between rounds | My design judgment, built on the paper’s argument for North Star KPIs |
| 5 | Never report an individual | Aggregate only, minimum cell of 8 responses | SPACE: report “only anonymized, aggregate results at the team or group level”; the cell size is mine |
| 6 | Match the scale to the measure | Agreement scales for perception, bucketed durations, hours and counts for workflow | My design judgment |
| 7 | Do not field it if you cannot act | Publish results and named owners within 14 days | Google’s Goals, Signals, Metrics chapter on when not to measure; the 14 days is mine |
Rule 7 has published backing from two directions and gets skipped the most. The Software Engineering at Google chapter on measuring engineering productivity lists the cases where you should decline to measure at all, including when you cannot change the process, when the decision-maker will not change their mind whatever the result, and when the result will be used as a vanity metric. The DevEx paper arrives at the same place from the other direction: “a lack of follow-up action commonly causes developers to feel that repeatedly responding to surveys is not a worthwhile exercise.”
A survey with no owner attached to each finding is a request for unpaid work from people who have already told you they have no focus time. Rule 7 is what protects next quarter’s response rate.
Choosing Between an Agreement Scale and a Duration Estimate
The scale follows from what the item is trying to capture, and the choices below are applied consistently across the bank in the next section.
- Agreement and satisfaction scales fit perceptual items, where the thing being measured is the respondent’s own assessment. “I can understand code I did not write” has no unit, and only the developer can score it.
- Duration and count buckets fit workflow items, where a real quantity exists and you want a self-reported estimate of it. Asking someone to rate their satisfaction with the number of tools in their path throws the number away.
- Offer buckets rather than a free-text figure. An open minutes box produces a distribution you cannot compare across rounds, because half the panel rounds to the nearest five and the other half includes the time spent waiting. Buckets also make the item fast to answer, which is what protects the completion rate.
- Frequency scales fit anything episodic. How often unplanned work displaces the plan is a rate, and a rate answered on an agreement scale turns into an opinion about the rate.
- Where the system can measure the same thing, ask anyway and compare the two. The Google chapter’s advice on using two metrics for one signal is that when they match “we have more confidence that we have reached some kind of truth”, and when they do not, “possibly one of them is incorrect and we need to explore further”.
The Developer Experience Survey Question Bank
Thirty-six items, grouped by what they measure. The wording is mine and free to copy, edit or discard. None of it is validated in the psychometric sense, so if the results will drive headcount decisions, test the wording in interviews first, which is what the DevEx paper recommends and what any decent voice of the customer program does before fielding anything.
Scale codes used in the tables:
| Code | Scale |
|---|---|
| AGR | Strongly disagree / Disagree / Neither / Agree / Strongly agree |
| SAT | Very dissatisfied / Dissatisfied / Neither / Satisfied / Very satisfied |
| FRQ | Never / Rarely / Sometimes / Often / Always |
| DUR | Under 5 min / 5 to 15 min / 15 to 60 min / 1 to 4 hrs / Over 4 hrs |
| HRS | Under 2 hrs / 2 to 5 hrs / 5 to 10 hrs / 10 to 15 hrs / Over 15 hrs |
| DAYS | Under a day / 1 to 2 days / 3 to 5 days / 1 to 2 weeks / Over 2 weeks |
| CNT | 0 / 1 to 2 / 3 to 5 / 6 to 10 / More than 10 |
| TXT | Free text |
DUR times a single event and HRS totals a week, so an item about one build cycle takes DUR and an item about a week of review load takes HRS. CNT counts objects rather than hours.
“Core” marks the 22 items I would field in the periodic census. The rest stay in the bank for the round where you want depth on one dimension.
Section A: KPI Block (Ask Every Round, Never Reword)
| # | Item | Scale | Measure | Core |
|---|---|---|---|---|
| A1 | Overall, I am satisfied with what it is like to build software here. | AGR | KPI | Core |
| A2 | In the last two weeks I was able to do the work I consider my real job. | AGR | KPI | Core |
| A3 | Shipping a small change to production here is straightforward. | AGR | KPI | Core |
| A4 | I expect to still be working here in twelve months. | AGR | KPI | Core |
Section B: Feedback Loops
| # | Item | Scale | Measure | Core |
|---|---|---|---|---|
| B1 | I am satisfied with how long my local build and test cycle takes. | SAT | Perceptual | Core |
| B2 | How long does a typical local build and test cycle take? | DUR | Workflow | Core |
| B3 | I am satisfied with how quickly my changes get reviewed. | SAT | Perceptual | Core |
| B4 | From opening a pull request, how long until the first substantive review? | DUR | Workflow | Core |
| B5 | When CI fails, I can tell why without asking anyone. | AGR | Perceptual | Core |
| B6 | How often does a CI failure turn out to be a flake rather than your change? | FRQ | Workflow | |
| B7 | How long does a change take to get from merged to running in production? | DAYS | Workflow |
Section C: Cognitive Load
| # | Item | Scale | Measure | Core |
|---|---|---|---|---|
| C1 | I can understand code I did not write without tracking down its author. | AGR | Perceptual | Core |
| C2 | Our internal documentation answers my question the first time I look. | AGR | Perceptual | Core |
| C3 | How many separate tools do you have to touch to ship one routine change? | CNT | Workflow | Core |
| C4 | Setting up or repairing my local environment is a solved problem. | AGR | Perceptual | Core |
| C5 | How long did your last local environment repair take? | DUR | Workflow | Core |
| C6 | I know who owns the services my work depends on. | AGR | Perceptual | |
| C7 | How many systems must you reason about to make a typical change safely? | CNT | Workflow |
Section D: Flow State
| # | Item | Scale | Measure | Core |
|---|---|---|---|---|
| D1 | In a normal week I get enough uninterrupted time to do focused work. | AGR | Perceptual | Core |
| D2 | How many hours of meetings did you have last week? | HRS | Workflow | Core |
| D3 | I know what the most important thing for me to work on this week is. | AGR | Perceptual | Core |
| D4 | I have real say in how my work gets done. | AGR | Perceptual | Core |
| D5 | How often does unplanned work displace what you had planned? | FRQ | Workflow | Core |
| D6 | I can raise a problem with how we work without it costing me anything. | AGR | Perceptual | |
| D7 | On a normal day, how many times do you switch between unrelated tasks? | CNT | Workflow |
Section E: AI Tooling
Worth adding because the friction is now measurable and specific. In the 2025 Stack Overflow Developer Survey, 33,244 respondents answered a question about how much they trust the accuracy of AI tool output, and 3.1% said they highly trust it. Stack Overflow’s summary of that same chart reports that more developers actively distrust the accuracy (46%) than trust it (33%). Among 31,476 respondents naming their frustrations with AI tools, 45.2% chose “debugging AI-generated code is more time-consuming”. An instrument that skips this section is measuring last year’s workflow.
| # | Item | Scale | Measure | Core |
|---|---|---|---|---|
| E1 | AI tooling makes me faster at the work I am actually measured on. | AGR | Perceptual | Core |
| E2 | How often do you have to debug AI-generated code that looked correct? | FRQ | Workflow | Core |
| E3 | I trust our AI tooling output enough to ship it after a normal review. | AGR | Perceptual | Core |
| E4 | How much of your week goes to reviewing code you did not write? | HRS | Workflow |
Section F: Segmentation Items (Not Scored)
| # | Item | Scale |
|---|---|---|
| F1 | Which team are you on? | Pick from list |
| F2 | What is your role? | Backend / Frontend / Mobile / Data / Platform / SRE / QA / Other |
| F3 | How long have you worked here? | Under 3 months / 3 to 12 months / 1 to 3 years / Over 3 years |
| F4 | Which environment do you spend most of your day in? | Pick from list |
| F5 | Do you carry a pager? | Yes / No |
Section G: Open Text
| # | Item | Scale |
|---|---|---|
| G1 | What is the single biggest thing slowing you down right now? | TXT |
| G2 | What is one thing we changed in the last quarter that helped? | TXT |
G2 is not decoration. It reports whether last round’s actions reached the people who raised the problem, which makes it the cheapest available check on rule 7.
How Many Questions Should a Developer Experience Survey Have?
Field 22 scored items and stop. Twenty-two items at roughly fifteen seconds each is five and a half minutes; five segmentation questions and two open-text boxes add about two more, which puts the whole instrument under eight minutes.
That number is my design judgment, not a research finding, and the parts that are evidenced should be separated from the parts that are not.
- Evidenced: the DevEx paper’s authors say their survey recommendations derive from partnering with hundreds of organizations, and they warn about sustaining participation rates over time.
- Evidenced: DORA’s public self-assessment is five questions and is advertised as taking under a minute.
- Evidenced: the 2025 Stack Overflow Developer Survey carried 62 questions and drew over 49,000 responses, though it is voluntary, public, and answered by people who want the resulting dataset.
- Not evidenced: the specific point at which an internal developer survey loses respondents. I could not trace a primary study publishing that threshold for engineering populations, and inventing one would be worse than admitting the gap.
Twenty-two comes from the arithmetic in the other direction. Four KPI items are fixed. Five items per dimension is enough that a bad score points somewhere specific, which puts the three dimensions at 19. Add three for AI tooling and the total is 22, which is the set marked Core in the bank above. Going past 22 means cutting the weakest item from whichever dimension scored flattest last round.
The pulse round is a different instrument: the four KPI items plus four rotating diagnostics, under two minutes, run in the quarters between full rounds.
How to Segment Results So a Six-Person Team Is Not Averaged Away
The DevEx paper names companywide reporting as “a common mistake made by organizational leaders” and points at exactly this failure, where focusing on aggregate results leads to “overlooking problems that affect small but important populations within the company, such as mobile developers.”
Here is what that looks like with numbers. A 200-developer org fields the survey and gets 140 responses, a 70% response rate. The item is B3, satisfaction with review turnaround, on a 1 to 5 scale.
| Group | Developers | Responses | Response rate | Mean score |
|---|---|---|---|---|
| Platform | 60 | 45 | 75% | 4.1 |
| Product backend | 80 | 52 | 65% | 3.8 |
| Web | 42 | 30 | 71% | 3.6 |
| Data | 12 | 9 | 75% | 3.4 |
| Mobile | 6 | 4 | 67% | 1.8 |
| Total | 200 | 140 | 70% | 3.77 |
The weighted company mean is 3.77. Had the mobile team scored the company average instead of 1.8, the company mean would read 3.83. The worst-affected team in the business moves the headline number by 0.06 points, which sits inside the noise of any round-to-round comparison you will make.
Mobile’s response rate is 67%, close to the company average, so the team answered at roughly the same rate as everyone else. Collection was not the problem. Six developers are 3% of the panel, and a company average weights them accordingly.
I print 1.8 for a cell of four here because the arithmetic is the point. A real readout gives that cell no mean at all, for the reason in the second bullet below.
- Report by segment first and by company second (my design judgment). The company number belongs in the appendix of the readout, not on the title slide.
- Set a minimum cell of 8 responses (my design judgment). Below that, publish no mean at all. Four responses is not a statistic, and printing 1.8 next to a team of six people also identifies them. For a cell under 8, book a 30-minute conversation with all six instead. You will learn more in that half hour than the item would have told you, and it is the same logic that makes small-sample customer discovery interviews worth more than a thin survey panel.
SPACE adds a constraint that catches people out once the org spans countries: perceptual measures carry cultural baselines, and the paper’s guidance is that measures from different cultures “will have a different baseline and shouldn’t be compared with each other”. Compare a team to its own last round before comparing it to another team.
A Fielding Cadence That Does Not Burn the Panel
The DevEx paper’s cadence line is the one to anchor on: quarterly or semi-annual for most organizations, with transactional surveys mixed in to produce higher-frequency feedback at specific touchpoints, such as prompting a developer when a specific error occurs during a CLI install. The same paragraph allows that for some organizations, benefits may accrue from running the periodic survey more frequently than that.
The paper names eBay and Pfizer as worked examples, and both run quarterly. eBay’s DevEx team captures KPIs including overall developer satisfaction and ease of development; Pfizer’s quarterly surveys capture overall satisfaction and engagement alongside specific factors such as codebase quality and team autonomy.
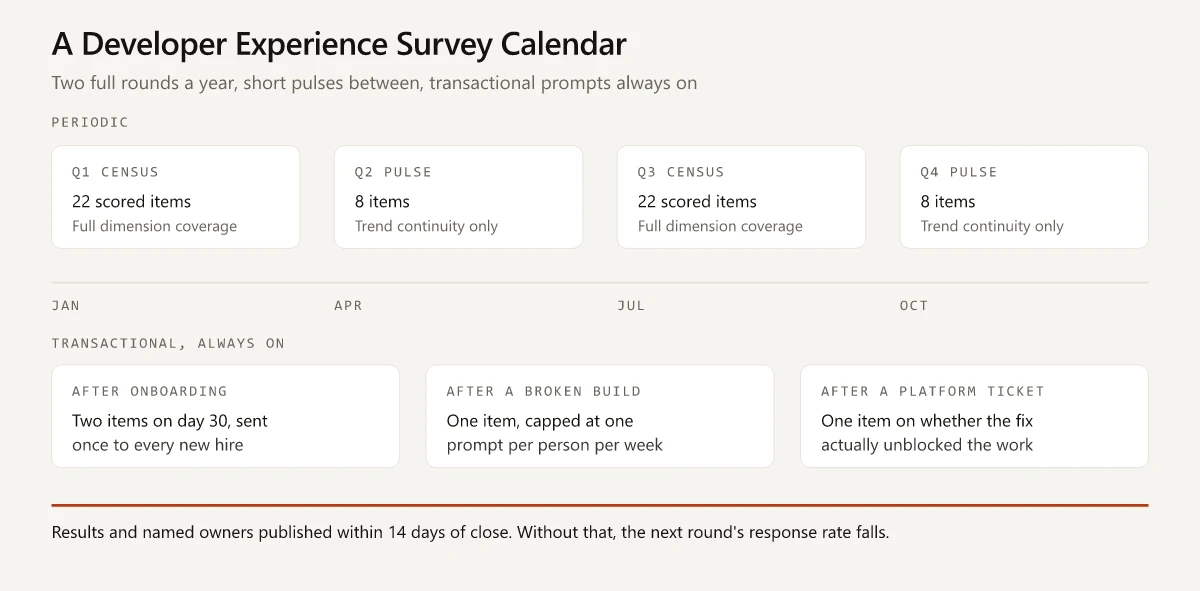
| Instrument | Length | When | What it is for |
|---|---|---|---|
| Full census | 22 scored items | Twice a year | Dimension coverage and the annual trend |
| KPI pulse | 8 items | The other two quarters | Trend continuity without the full ask |
| Onboarding transactional | 2 items | Day 30 for every new hire | Time to first merge and setup friction, while it is still fresh |
| Failure transactional | 1 item | After a broken build, capped at one prompt per person per week | Feedback loop quality at the moment it matters |
| Ticket transactional | 1 item | On close of a platform or internal support ticket | Whether the fix actually unblocked the work |
The caps on the transactional prompts are mine. A prompt that fires on every failure becomes a thing developers learn to dismiss, and a dismissed prompt is worse than no prompt because it trains the reflex.
What to Do in the Two Weeks After the Survey Closes
Route every finding to a named owner, on the same page as the number. Not a function, a person. The pattern that works is the one that makes a developer community strategy survive a headcount review: one owner per surface who is graded on it, rather than a shared responsibility that belongs to nobody in particular.
- Day 1 to 3: clean, segment, and check every cell against the minimum of 8.
- Day 4 to 7: readout by segment, with the company number in the appendix.
- Day 8 to 14: publish the three things being fixed, each with a name and a date, plus the things that are not being fixed and the reason.
That last clause buys the next round’s response rate. Telling 200 engineers their build times are staying as they are because the platform team is migrating auth this quarter is a survivable answer. Silence is not.
Fielding Your First Developer Experience Survey
Take the 22 core items above, cut the AI section if your org has not adopted the tooling yet, and add the five segmentation questions you can actually join to a team roster. Field it once, publish the segmented result inside fourteen days, and only then argue about which dimension deserves more items. The instrument gets better by being run, and a developer experience survey nobody acted on costs more than a slightly clumsy first draft.
Where this sits in the wider function: the survey is one input into the docs, free-tier and education surfaces described in the developer marketing operating model. It is the input that tells you which of them is costing you engineers.
Frequently Asked Questions
What is a developer experience survey?
A developer experience survey is a periodic instrument that captures developers' self-reported perceptions of their own working conditions, usually alongside system data about the same workflows. It measures friction, satisfaction and focus rather than output, and it is fielded by team and role so that small groups stay visible in the results.
How many questions should a developer experience survey have?
Field around 22 scored items plus a few segmentation questions and two open-text boxes, which takes under eight minutes. That is my design judgment rather than a published finding. For comparison, DORA's public Quick Check is five multiple-choice questions and the 2025 Stack Overflow Developer Survey ran 62 questions as a voluntary public census.
What is the difference between DORA metrics and a developer experience survey?
DORA's guide describes its five metrics as measures of the outcomes of the software delivery process: change lead time, deployment frequency, failed deployment recovery time, change fail rate and deployment rework rate. A developer experience survey measures how the people inside that process experience it, which is a separate class of measure that the DevEx paper calls perceptual.
How often should you run a developer experience survey?
The DevEx paper by Noda, Storey, Forsgren and Greiler states that a quarterly or semi-annual cadence is optimal for most organizations, with transactional surveys mixed in at specific touchpoints for higher-frequency feedback. The same paper names lack of follow-up action as the common cause of falling participation.
What should a developer satisfaction survey ask about?
Cover the three DevEx dimensions of feedback loops, cognitive load and flow state, plus a short KPI block that never changes between rounds. Ask a satisfaction question and a friction question separately, because a developer can be content with a slow build they have already planned around.