SaaS Win Rate Benchmark: The Numbers You Can Verify
Most SaaS win rate benchmark figures online have no traceable source. Here are the published numbers with their dates, sample sizes and denominators attached.

A win-rate target feeds three plans that do not correct themselves - pipeline coverage, quota capacity and headcount - so a SaaS win rate benchmark that is eight points wrong does its damage a long way from the sales dashboard.
Work the arithmetic once. A team carrying $12M in new ARR at a $60,000 average deal needs 200 closed-won deals, and a rep can carry roughly 60 qualified opportunities a year.
| Win rate used for planning | Qualified opportunities needed for 200 wins | Reps required |
|---|---|---|
| 30% | 667 | 12 |
| 22% | 909 | 16 |
An eight-point error in that one input is 242 extra opportunities, 36% more pipeline than anyone budgeted, and four reps nobody hired. The forecast breaks in month two and the quota model gets rebuilt in month four.
The 30% almost always comes from a blog post. I checked the pages ranking for this term, and the pattern is consistent: a confident single figure or a tidy table, with no report named, no date, no sample size, and no statement of what sat in the denominator. That is worse than no number, because a sourceless benchmark still gets typed into a board deck.
Win rate is one of the least standardized metrics in B2B. Whether you count all opportunities or only qualified ones, whether no-decision losses sit in the denominator, and which stage you start counting from will move the result by more than the gap between a good sales team and a bad one. Every figure below is traceable to a dated source with its definition stated, or it is named as untraceable and the reason is given.
Published win rate benchmarks with a traceable source:
- Sales-sourced opportunities, 43%. ICONIQ’s 2026 State of Go-to-Market, March 2026, N = 145 on the win-rate chart. The formula is printed under the chart as a footnote.
- Channel and partner-sourced, 39%; marketing-sourced, 27%; customer-success-sourced, 52%. Same ICONIQ 2026 chart, same definition.
- Self-reported SaaS win rate by source, 35% to 40% (sales), 25% to 35% (channel), 18% to 22% (marketing). ICONIQ’s 2025 State of Go-to-Market, June 2025, from the survey question “What is your approximate average win rate by opportunity source?” No formula was given that year.
- RFP win rate, 39% of submissions; 45% across 2019 to 2026. Loopio’s 2026 RFP Response Trends and Benchmarks Report, the seventh annual edition, March 2026. Loopio’s report landing page gives the sample as 1,500+ global companies and 250,000+ RFPs.
- 40% to 60% of deals lost to no decision. Matthew Dixon and Ted McKenna in Harvard Business Review, 24 June 2022, from more than 2.5 million recorded sales conversations.
- Year-over-year change only: win rates down 10% in 2025 after down 18% in 2024. Ebsta’s 2025 GTM Benchmarks Report announcement, 22 April 2025. The accompanying sales-efficiency digest gives the sample as 655,000 opportunities and $48 billion of pipeline, and states on its own page two that all its percentage figures are relative.
Every figure above is checkable. Everything I could not check is listed further down, with the reason.
What is win rate in SaaS? Win rate is the share of sales opportunities that end in a closed-won deal, most commonly calculated as closed-won divided by closed-won plus closed-lost, times 100. The definition breaks down in practice because companies disagree on which opportunities enter the denominator, whether deals lost to no decision are counted, and which pipeline stage starts the count. Two teams with identical sales performance can report win rates more than 27 points apart on those choices alone.
Why Win Rate Is the Least Standardized Metric in B2B
The formula looks settled. Wins divided by something, times 100. The argument is entirely about the something.
HubSpot’s own guidance on the metric, updated 28 July 2025, states the problem plainly: some organizations “divide wins solely by the number of prospects that made a buying decision”, while others include “No Decision” so that a prospect who took a demo, took a quote and then bought nothing lands in the win rate. Both are in use. Both are called win rate.
| Choice | What goes in the denominator | Which way it moves the number |
|---|---|---|
| All opportunities or qualified only | Every opportunity a rep created, or only those past the entry gate | Qualified-only reads higher. Teams that changed nothing about how they sell have moved their reported rate by double digits by tightening what counts as an opportunity |
| No-decision losses in or out | Stalled deals filed as closed-lost, or left open, marked “on hold” or recycled to marketing | The biggest single lever. In the worked example below it is the difference between 25.0% and 40.0% |
| Where the count starts | Stage 1 onward, or a late stage such as post-discovery | A later start reads higher and answers a narrower question: how well you close what you already qualified |
| Deals or dollars | Opportunity count, or ARR value | The ARR-weighted version reads lower whenever competitive losses skew large and no-decision losses skew small |
Every one of those is defensible. Publishing the result without saying which you picked is not. The stage choice in particular splits the audience: an early-stage win rate tells you how well the whole system converts, a late-stage one tells you how well you close what you qualify, and product marketing usually wants the first while the CFO wants the second.
No-Decision Losses: Counted, Excluded, or Invisible
This is the most common place for a number to get flattered by accident. If a deal that stalls out and dies is closed-lost, it sits in the denominator. If it is left open forever, marked “on hold”, or recycled back to marketing, it never enters the calculation at all.
The scale of the category is the reason this matters. Dixon and McKenna’s Harvard Business Review analysis of more than 2.5 million recorded sales conversations found that anywhere between 40% and 60% of deals end lost to customers who express intent to purchase but ultimately fail to act. A team that files those as anything other than a loss is publishing a head-to-head competitive record under the name win rate.
One Deal Set, Five Win Rates
One sales team, one quarter, one set of records.
| The deal set, one quarter | Count |
|---|---|
| Opportunities created | 240 |
| Reached the qualified stage | 150 |
| Closed inside the period | 120 |
| Won | 30 |
| Lost to a named competitor | 45 |
| Lost to no decision | 45 |
| Still open at period end | 120 |
| ARR won, against total closed ARR | $1.2M of $5.25M |
The 120 still open include the 90 that never cleared qualification and were never formally disqualified either, which is the normal state of a pipeline nobody prunes.
| Definition | Calculation | Win rate |
|---|---|---|
| Won over all closed deals | 30 / 120 | 25.0% |
| Won over competitive outcomes only (no-decision excluded) | 30 / 75 | 40.0% |
| Won over every opportunity created | 30 / 240 | 12.5% |
| Won over all qualified opportunities, including still-open | 30 / 150 | 20.0% |
| ARR-weighted, won over all closed value | $1.2M / $5.25M | 22.9% |
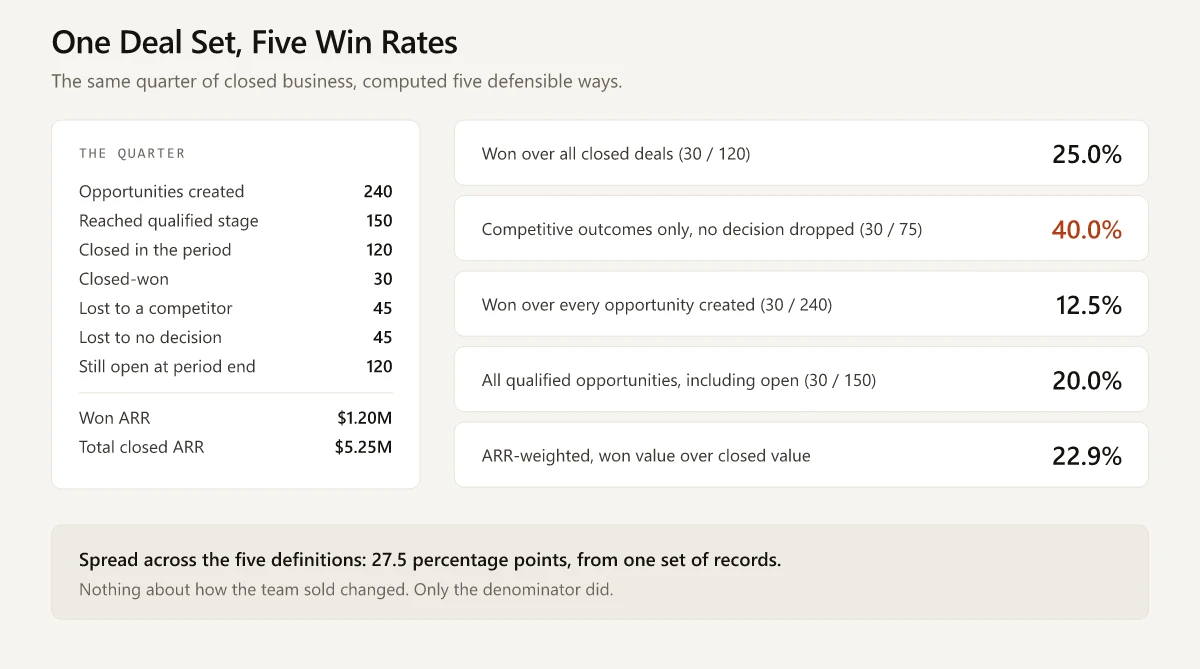
The spread is 27.5 percentage points from a single set of records. That is wider than the 25-point gap between the highest and lowest figures in ICONIQ’s own 2026 chart. A company reporting 40% and a company reporting 12.5% can be the same company in the same quarter.
The second row is where most of the inflation happens. Dropping the 45 no-decision losses adds 15 points to that quarter, and it is rarely a deliberate choice.
The Win Rate Benchmarks I Could Not Trace
Three figures circulate widely on this topic. None survived a check against the source they are attributed to.
| Circulating claim | What the cited source actually contains | Why it fails |
|---|---|---|
| ”The average B2B win rate is 19%, down from 29%, per the Ebsta x Pavilion 2025 GTM Benchmarks” | Ebsta’s 2025 sales-efficiency digest prints two win-rate figures: a year-over-year change of -10% for 2025 against -18% for 2024 on the seller-performance panel, and a series running 18%, 13%, 8%, 5% and 3% by how long a deal slipped, from one week to beyond six months, on printed page nine | Neither figure is 19% or 29%, and the digest publishes no average or headline win rate at all |
| Win rate by deal size: “35-45% under $50k, 25-35% at $50k to $100k, 15-25% above $100k” | The same digest carries a deal-size breakdown of its own sample composition, not win rates by deal size | The table is not in the document it is credited to |
| ”Industry average around 21%“ | No named study, no date, no denominator on any page carrying it | Nothing to check against |
The digest shows how a number like the 19% gets manufactured. Its methodology box on printed page two reads: “All percentage figures are relative. For example, a win rate increase from 20% to 30% is +50%.” Anyone taking the seller-performance panel at face value reads a level where the publisher printed a change.
The one series that does look like a set of levels sits on page nine, plotted against deal-slippage duration beside the line “the more deals slip the lower the win rate”, and the blanket note about relative percentages leaves even that one ambiguous.
The digest is a 15-page snapshot, not the full study - its own page two says “This Digest is a snapshot from the 2025 GTM Benchmarks Report” - so the first two rows above are statements about the digest, which I read end to end, and about the dated announcement. I did not obtain the full report and make no claim about what is in it.
A bare average with no definition is the number people actually adopt, which makes the last row the most damaging of the three. A benchmark you can set a target against has to tell you when it was measured, who was in the sample and what went in the denominator. Two out of three is not enough.
You can run this check yourself on any benchmark you find, in about a minute. A figure has to answer all of these:
- Which named report is this from, and can I open it? A vendor blog citing “industry data” is a dead end. A vendor blog citing a report with a title and a link is a starting point.
- What date was it published, and what period does the data cover? Those are different dates, and a 2026 blog post frequently carries a 2021 figure.
- How many companies or deals are in it? A benchmark with no disclosed sample is an opinion with a percentage sign.
- What is in the denominator? If the source does not say, the number cannot be compared to yours, no matter how carefully you compute your own.
Applying that check is what removed the three figures above from this post. It also removed several tidy-looking tables that turned out to trace back to each other in a circle, which is the characteristic failure mode of benchmark content on a topic where the primary research is thin.
Absence is its own signal. Benchmarkit’s 2025 SaaS Performance Metrics Benchmarks is one of the most widely-cited SaaS metric datasets in circulation, covering growth rate, net revenue retention, CAC ratio, CAC payback, burn multiple, ARR per FTE and gross margin. Win rate is not in it.
When a survey of that quality skips a metric, the reasonable inference is that the metric is too inconsistently defined across respondents to aggregate, not that nobody thought of it.
What the Published SaaS Win Rate Benchmark Data Shows
Here is everything I could verify, with the caveats attached rather than stripped off.
| Source | Published | What it measures | Figures | Denominator stated |
|---|---|---|---|---|
| ICONIQ, State of GTM 2026 | March 2026 | Win rate by opportunity source, N = 145 | Sales 43%, channel/partner 39%, marketing 27%, customer success 52% | Yes: closed-won / (closed-won + closed-lost) x 100 |
| ICONIQ, State of GTM 2025 | June 2025 | Self-reported average win rate by source, N-sizes 74 / 57 / 37 / 37 across four ARR bands | Sales 35-40%, channel/partner 25-35%, marketing 18-22% | No formula given; survey asked for an “approximate average” |
| Loopio, 2026 RFP Trends | March 2026 | RFP win rate; sample given on the report page as 1,500+ companies, 250,000+ RFPs | 39% average, 45% across 2019-2026, UK 47%, Europe 39%, North America 37% | Implied: RFPs won / RFPs submitted |
| Ebsta, 2025 GTM digest | April 2025 | Year-over-year change, 655,000 opportunities | -10% in 2025, -18% in 2024 | No: the digest states all its percentages are relative |
| Crayon, State of Competitive Intelligence 2026 | 2026, ninth edition | Direction of change against competitors | 49.6% saw win rate against competitors rise, 6.3% saw it fall | No level, no sample size disclosed |
| Dixon and McKenna, HBR | June 2022 | Share of deals lost to no decision, 2.5M+ conversations | 40% to 60% | Yes: deals where the buyer states intent and does not act |
ICONIQ Is the Cleanest SaaS Number Available
ICONIQ’s 2026 report is the only source in this set that publishes an absolute SaaS win rate with the formula printed under the chart. The same footnote gives the sample as N = 145 for the 2026 series and N = 165 for the restated 2025 comparison series, which is a different cut from the 74 / 57 / 37 / 37 ARR-band N-sizes printed in the 2025 report itself. Win rates rose across all three sources ICONIQ compares year over year: 38% to 43% for sales, 35% to 39% for channel and partner, and 23% to 27% for marketing.
The single most useful line in it is not the headline: customer-success-sourced opportunities converted at 52%, the highest of any source, which the report attributes to selling into established relationships where ROI has already been demonstrated. If your expansion motion runs through CS and your new-logo motion runs through marketing, blending them into one company-wide win rate produces a number that describes neither.
The same publisher changed how it produced this metric between editions, which is the argument of this post inside one source.
| ICONIQ edition | How the number was produced | Comparable to yours |
|---|---|---|
| State of GTM 2025, June 2025 | Survey question: “What is your approximate average win rate by opportunity source?” No formula printed | No |
| State of GTM 2026, March 2026 | Same chart, footnoted “Win rate = (# closed-won / # of closed-won + lost)*100” | Yes, once you match the formula |
Same publisher, same metric, one year apart, and only the second version can be matched against anything.
Loopio Is the Cleanest RFP Win Rate
RFP win rate has an advantage that pipeline win rate does not: the denominator is obvious. You submitted a response or you did not.
| Loopio 2026 RFP measure | Figure |
|---|---|
| Average win rate, submissions won | 39% |
| Average across 2019 to 2026 | 45% |
| UK / Europe / North America | 47% / 39% / 37% |
| Advancement rate to shortlist | 46% |
| RFPs submitted per team per year | 166, up from 153 |
| Share of received RFPs responded to | 55% |
| Teams sticking to a go/no-go process | 75%, an 8-point drop from 2024 |
| Top performers using a go/no-go process | 81% |
| Share of total revenue RFPs influence | 30% to 40%, consistently since 2019 |
Advancement rate and win rate read together tell you whether your problem is getting on the shortlist or closing from it, which is a more useful diagnostic than a single conversion number.
RFP win rate also carries a trap that pipeline win rate does not. Submission volume sits directly in the denominator, so declining more bids raises the rate mechanically. Run the arithmetic on two teams:
- Team A submits 166 responses at a 39% win rate, which is about 65 wins.
- Team B submits 100 responses at a 55% win rate, which is 55 wins.
Team B has the better benchmark and ten fewer wins. Whether that is the right trade depends entirely on what the declined 66 responses cost to produce and what else that capacity could have done, which is a resourcing question the win rate cannot answer on its own.
Loopio’s data suggests the market is moving the other way. Go/no-go discipline fell while submissions rose from 153 to 166, which is a volume response to pressure rather than a selectivity response, and the most likely explanation for a 39% current average against a 45% long-run one.
If RFPs matter to your number at all, the sizing figure to carry into a planning conversation is the 30% to 40% of total revenue they influence. A metric attached to a third of revenue deserves a stated denominator.
Crayon Publishes Direction, Not Level
Crayon’s 2026 State of Competitive Intelligence, the ninth annual edition, reports direction of travel rather than a level.
| Crayon 2026 finding | Figure |
|---|---|
| Say more of their deals are competitive than a year ago | 57.5% |
| Say competitive pressure eased | 16% |
| Say at least half their opportunities are competitive | Seven in ten teams |
| Saw their win rate against competitors increase | 49.6% |
| Saw their win rate against competitors fall | 6.3% |
| Self-rated rep preparedness for competitive deals | 6.3 out of 10 |
Directional data like this carries a trend argument and cannot carry a target. The page does not disclose a sample size, and “win rate against competitors” is a fourth denominator on top of the ones above. The preparedness score in the last row is the number I would actually take to an enablement conversation.
How to Compute a Comparable Win Rate
Before you compare yourself to any of the numbers above, build a version of your own that could survive being published. Five decisions, made once, written down where the dashboard lives.
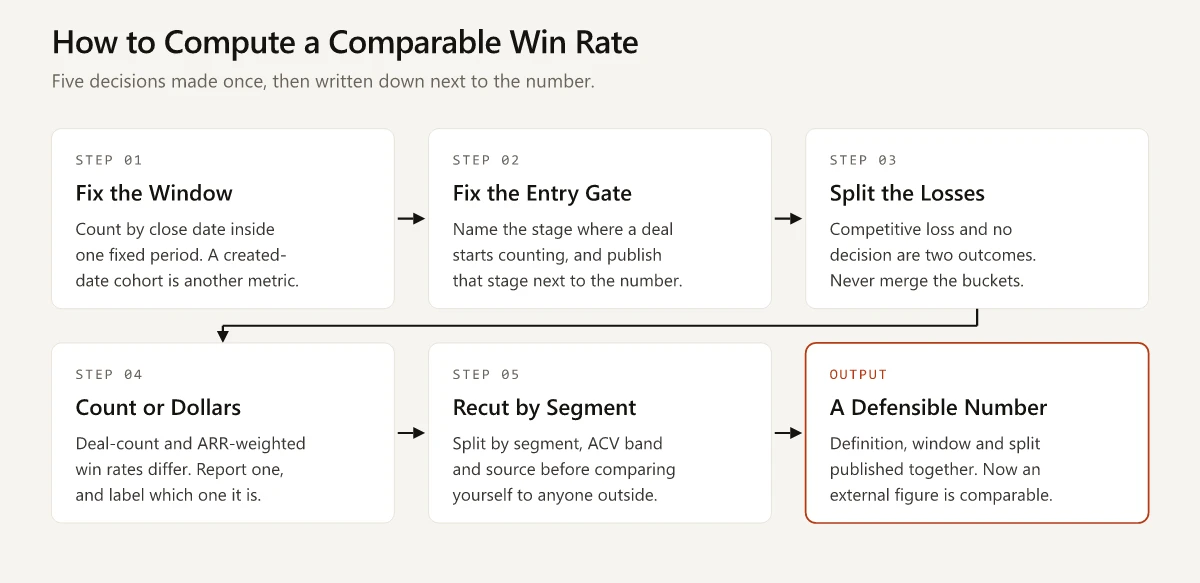
- Fix the window by close date. Count deals that closed inside one period. A created-date cohort answers a different and slower question, and mixing the two is how a win rate becomes untraceable three quarters later.
- Name the exact stage at which an opportunity starts counting, and write that stage name next to the metric. “Win rate 31% (from Stage 2, Discovery Complete)” is a benchmark. A bare “win rate 31%” is trivia.
- Split the losses into competitive and no decision. These need separate values in the loss-reason field, and a rep should not be able to save a closed-lost record without picking one. Report both a full win rate and a competitive win rate, and never let the second one travel alone.
- Pick count or dollars, and label which one the headline number is. Run both if you like. If they sit more than a few points apart, that gap is itself a finding about where your large deals go.
- Recut by segment, ACV band and source before comparing outward. ICONIQ’s data shows a 25-point spread between marketing-sourced opportunities at 27% and customer-success-sourced at 52% inside the same set of companies. A blended company number cannot be matched against anyone.
Once the definition is fixed, the reporting layer is straightforward, and I have written up the panel structure separately in the win-loss analysis dashboard breakdown - that post covers what to build, this one covers what the number means once you have it.
One call I would make firmly: if your no-decision rate is not currently measurable because the CRM cannot express it, fix that before you set any target at all.
Win Rate and Stage Conversion Rate Are Not the Same Number
Benchmark pages blur these two constantly, and the confusion is expensive because the two metrics fail for opposite reasons.
Stage conversion rate measures movement between two adjacent pipeline stages: what share of stage 2 opportunities reach stage 3. Win rate measures the terminal outcome of a cohort. A pipeline can have healthy stage conversion at every step and a poor win rate because the leakage is distributed rather than concentrated, or one catastrophic stage transition and an acceptable win rate because the deals that survive that stage close well.
The practical distinction:
| Stage conversion rate | Win rate | |
|---|---|---|
| Question it answers | Where does the pipeline leak | How much of what we work do we close |
| Denominator | Opportunities entering one stage | Opportunities in a closed cohort |
| Fails by | Hiding the total loss when spread evenly | Hiding the location of the loss |
| Who acts on it | Sales ops, enablement | Finance, product marketing, the board |
| Time to read it | Weekly | One full sales cycle, minimum |
Product marketing needs both. Win rate sizes the problem, which is what gets a project funded; stage conversion locates it, which is what tells you which asset to build. A win rate that fell four points with no change in stage conversion usually means deal mix changed, not that positioning broke.
Sample Size: When Your Own Win Rate Is Noise
The most common reason a win rate “moves” is that it did not move. This is arithmetic anyone can check, and it is missing from every benchmark page I read on this topic.
A win rate is a proportion. Its standard error under the usual normal approximation is the square root of p times one minus p, divided by n, where p is the win rate and n is the number of closed deals in the cohort. At a 25% win rate, here is what the roughly 95% margin of error looks like as the deal count grows:
| Closed deals in the period | Approximate 95% margin of error at p = 0.25 |
|---|---|
| 30 | plus or minus 15.5 points |
| 50 | plus or minus 12.0 points |
| 100 | plus or minus 8.5 points |
| 200 | plus or minus 6.0 points |
| 400 | plus or minus 4.2 points |
| 1,000 | plus or minus 2.7 points |
Read the first row carefully. A team closing 30 deals a quarter and reporting a 25% win rate has a true rate that could plausibly sit anywhere from about 10% to about 40%. Comparing that against a published 43% benchmark tells you nothing about either team.
The rules I would apply:
- Under 50 closed deals per period, do not report a quarterly win rate at all. Report a rolling four-quarter figure and let the cohort accumulate.
- Under 100 closed deals, treat any single-quarter movement of less than 8 points as noise unless something specific changed in the same period.
- Segment cuts inherit the problem and make it worse. A win rate for enterprise deals in EMEA, at n equals 12, is a story rather than a measurement.
- Dollar-weighted win rates are noisier still at small n, because one large deal swings them. If you publish an ARR-weighted figure on fewer than 100 closed deals, publish the deal count next to it.
Match the reporting cadence to the deal count. It is the cheapest accuracy improvement available to a small revenue team.
What Moves Win Rate From the Product Marketing Seat
Sales owns the number. Product marketing owns the inputs that move first.
Competitive Positioning Decides More Than the Demo
The seven-in-ten competitive-deal figure and the 6.3 preparedness score in the Crayon table above describe the same gap, and it is a product marketing deliverable rather than a sales training problem.
The work that shifts it is unglamorous: a current, dated competitive claim set that a rep can use inside a live call, refreshed on a cadence rather than at launch. The competitive battlecard template I use starts from the objections that actually appeared in lost deals rather than from a feature matrix, because the feature matrix is the thing reps already have and do not open.
Positioning shows up in the win rate as a shape rather than a level, which is why the blended number hides it.
| Pattern in the loss data | What it means | What fixes it |
|---|---|---|
| Losing to one competitor in one segment while beating them elsewhere | A positioning problem with a location | A segment-specific claim, rewritten and tested in live calls |
| Losing evenly to everyone | A pricing or product problem being read as a messaging one | Nothing a battlecard touches; escalate it with the loss data attached |
The measurement that makes this visible is a competitive win rate held separately from the overall figure, computed only across deals where a named competitor was tagged and the outcome was won or lost:
- It removes no-decision losses from the denominator by construction, which makes it stable enough to read at lower volumes than the overall rate.
- It moves faster after a messaging change, because head-to-head deals are where a new claim gets tested first.
The catch is that competitor tagging is usually an optional field and therefore incomplete, so treat a competitive win rate computed on a partly-tagged set as directional until tagging is enforced at the same point as the loss reason.
No-Decision Losses Need Their Own Bucket
The 40% to 60% figure from Dixon and McKenna is the most consequential number in this post, because it describes the category a default CRM loss-reason picklist cannot express. There is usually no no-decision value to pick, so reps choose the nearest thing or leave the record open, and a deal filed as “lost to Competitor X” when the buyer actually bought nothing sends product marketing to build a battlecard against a competitor who was never the reason.
Gartner’s research points at the mechanism. Its survey of 632 B2B buyers, conducted in August and September 2024 and published 7 May 2025, describes a buying group that cannot agree with itself.
| Gartner finding, 632 B2B buyers | Figure |
|---|---|
| Buyer teams showing unhealthy conflict during the decision process | 74% |
| What counts as unhealthy conflict | Conflicting objectives, disagreement on the course of action, or being overruled by an external decision-maker |
| Size of a B2B buying group | Five to 16 people, across as many as four functions |
| Groups reaching consensus, likelihood of describing the deal as high-quality | 2.5 times higher |
That reframes the no-decision loss. Dixon and McKenna open their argument by noting that salespeople have been taught for decades that a lost sale means they failed to defeat the customer’s status quo, and their data points at buyer indecision instead. Read alongside Gartner’s conflict finding, a large share of these losses are internal deadlocks the seller never saw. The product marketing response is different from the competitive response:
- Build consensus material aimed at the group, not the champion. Gartner’s finding is that content tailored to individual-level relevance made consensus worse.
- Give the champion an internal business case they can forward without you in the room, sized for a finance reviewer who never took the demo.
- Name every alternative the committee is weighing, including doing nothing, and put a cost on the do-nothing option.
- Track no-decision as its own trend line. If it is rising while competitive losses are flat, the problem is the buying process, not the competitor.
Win-Loss Interviews Catch What a CRM Field Cannot
A closed-lost reason is a rep’s theory of the loss, recorded by the person with the least incentive to be candid about it and the least access to the room where the decision happened. It is a starting hypothesis and nothing more.
The structured alternative is a real interview program, which I have covered end to end in what win-loss analysis is and how to run it. What shows up in interviews and never shows up in a picklist:
- The reason behind the reason. “Price” in the CRM is frequently a value-articulation failure discovered under questioning, and the two have opposite fixes.
- The evaluation criteria you never saw. Buyers routinely score on a requirement nobody on your side knew was scored, and that requirement is a positioning input.
- The point where you actually lost. Often several weeks before the deal was marked lost, and often at a moment product marketing could have influenced with an asset that did not exist.
Getting truthful answers depends heavily on how the interview is run, which is why I keep a fixed set of win-loss interview questions rather than improvising, and why the wins get interviewed as well as the losses. A win-only or loss-only program produces a story rather than a comparison.
Feed all of it back into the metric set the function is accountable for. Win rate belongs alongside the other product marketing metrics that carry a definition rather than a vibe, and it earns its place there only once the definition is written down.
Setting the Target From Your Own Trailing Series
External benchmarks are a sanity check on direction. The target itself should come out of your own history, because that is the only dataset where you control the denominator.
The sequence I would follow, in order:
- Rebuild the last eight quarters under one definition. Not the definition each quarter used at the time - one definition, applied backwards, with the no-decision split reconstructed from loss notes where the field was empty. This is tedious and it is the whole job. A trailing series computed under three different rules is three charts pretending to be one.
- Plot the series with the closed-deal count on the same axis. Quarters with thin denominators get read differently, and putting n on the chart stops that argument happening every time.
- Take the median of the last four quarters as the base, not the best quarter. Peak quarters are usually mix effects, and a target set off the peak becomes a coverage shortfall two quarters later.
- Set the target as a movement off the base with a named mechanism attached. “27% to 30% by improving competitive win rate in mid-market” is defensible. “30% because the benchmark says 30%” gives nobody anything to do on Monday.
- Recheck against an external figure only at the end, and only after matching source and segment. If your marketing-sourced win rate is 22% against ICONIQ’s 27%, that is a real five-point gap worth a project. If your blended number is 22% against a blended 43% from a different denominator, you have learned nothing.
The mechanism matters more than the number. A win-rate target with no named lever behind it turns into pipeline pressure by default, which raises opportunity volume, which lowers win rate, which is the loop this whole exercise exists to break.
One more control worth building in: agree in advance what evidence would make you revise the target down. Win-rate goals are hard to lower once they are in a plan, because lowering one implies a coverage gap somebody has to fund.
| Revision trigger agreed before the quarter starts | What it tells you |
|---|---|
| Two consecutive quarters below the base | The base was set off a peak rather than the median |
| Mix shift into a lower-converting segment or source | The blended target no longer describes the motion being run |
| Closed-deal count falls below 50 in the period | The movement is inside the margin of error and nothing should be revised on it |
Naming those before the quarter starts makes the conversation a scheduled review rather than an argument.
What Is a Good Win Rate in SaaS?
There is no single good number, because the metric is not standardized enough for one to exist. Against the cleanest available comparison, ICONIQ’s 2026 data, 43% for sales-sourced opportunities, 39% for channel and partner, 27% for marketing-sourced and 52% for customer-success-sourced are the reference points. For RFP responses, Loopio’s 39% of submissions is the current average and 45% is the multi-year figure.
Those numbers only become usable once you match the definition behind them. In the worked example above, one quarter of one team’s records reads 25.0% with no-decision losses counted and 40.0% with them dropped, and no external comparison survives that gap.
Setting a SaaS Win Rate Benchmark You Can Defend
The reason this SaaS win rate benchmark exercise is worth an afternoon is that the number leaves the room. It reaches a quota model and a hiring plan within a quarter, and by the time anyone questions the denominator, three quarters of decisions have been made on top of it.
Start with the loss-reason picklist.
Frequently Asked Questions
What is a good win rate in SaaS?
There is no single number, because the denominator is not standardized. Against ICONIQ's 2026 State of Go-to-Market data, which defines win rate as closed-won divided by closed-won plus closed-lost, sales-sourced opportunities land at 43%, channel and partner at 39%, marketing-sourced at 27% and customer-success-sourced at 52%. Compare yourself only after matching that definition.
How do you calculate win rate in SaaS?
The most commonly published formula is closed-won opportunities divided by closed-won plus closed-lost, times 100. That excludes deals still open. A stricter version divides closed-won by every opportunity created in the cohort, which produces a much lower number. Publish which one you used next to the result.
What is a good RFP win rate?
Loopio's 2026 RFP Response Trends and Benchmarks Report, drawn from more than 1,500 teams, puts the average at 39% of submitted RFPs won, against a 45% average across its 2019 to 2026 data. The UK led at 47%, Europe at 39% and North America at 37%.
Should no-decision losses count in your win rate?
They should be counted, and counted separately. Harvard Business Review research by Matthew Dixon and Ted McKenna, built on more than 2.5 million recorded sales conversations, found 40% to 60% of deals end lost to buyers who state an intent to purchase and then fail to act. Dropping that group from the denominator inflates your win rate and hides the largest fixable loss category you have.
Why do published sales win rate benchmarks disagree?
Because they measure different things. Some count opportunities, some count RFP submissions, some count dollars, some report only the year-over-year percentage change. Two teams performing identically can publish win rates more than 27 points apart on definitional choices alone.