Google Search Console Impressions Drop: Bug or Real Loss?
A Google Search Console impressions drop with steady clicks and a better average position on one date usually means a reporting change. My April 2026 data shows it.
You open the Performance report and see a Google Search Console impressions drop: the impressions line has stepped down and stayed down. The clicks line under it has barely moved. Average position, which you expected to worsen, has improved by ten or twenty places inside a couple of days.
This site’s export has the same shape at the end of April 2026. Across the 14 days to 26 April it averaged 1,530.6 impressions a day at an average position of 38.2, with 10 clicks. In the 14 days from 28 April it averaged 998.1 a day at 14.0, with 9 clicks. Daily average position read 31.5 on 26 April, 19.6 on 27 April and 13.4 on 28 April, and 27 April is the last day of a Search Console logging error listed on Google’s Data anomalies page. On a chart with this shape, the date of the drop tells you more than its size.
Google dates its known reporting issues on that page. If your drop starts on one of those dates and clicks held, the impressions that went had produced no clicks, so a page rewrite has nothing to win back.
Why Did My Google Search Console Impressions Drop?
When clicks held and average position improved on the same date, the likely cause is a Google reporting change rather than lost rankings. Two changes cut reported impressions: Google stopped honoring the num=100 parameter around 10 September 2025, and a Search Console (GSC) logging error that affected impressions from 13 May 2025 ended after 27 April 2026.
Match what your Performance report shows to a row, then confirm the cause where the last column points.
| What the Performance report shows | Shape over time | Likely cause | Where to confirm it |
|---|---|---|---|
| Impressions down, clicks steady, average position better | A step on one date that Google has published | A reporting change, such as the end of the logging error on 27 April 2026 | Data anomalies page, entries covering your date |
| Impressions down, clicks steady, average position better | Builds over days or weeks, with no Google date | Rankings lost deep in the results, past position 20 | Queries tab against the previous period: the queries that lost impressions ranked worse than 20 |
| The same pattern, mostly on desktop | A step around 10 September 2025 | The num=100 change: the parameter no longer loads 100 results per page | Devices tab, where the fall sits in desktop impressions |
| Impressions and clicks both down in one search appearance or report | A step on a date Google lists | A logging error that cut both metrics | Data anomalies page, such as the Job listing and Job details entry for 16-27 April 2026 |
| Impressions down in the FAQ search appearance only | A step from 7 May 2026 | FAQ rich results no longer shown in Google Search | Data anomalies page, 7 May entry; the Search appearance tab |
| Impressions, clicks and position all worse | Starts inside a published rollout | A core or spam update | Search Status Dashboard ranking history |
| Losses concentrated on pages or templates you changed | Within days of a deploy; a misplaced noindex falls slowly | Your own deploy | Google’s guide to debugging traffic drops, under Technical issues |
| Impressions and clicks falling on URLs that leave the index | Gradual, tracking the indexed-page count | Indexing loss | Page indexing report |
| A dip in the same weeks last year | Repeats every year | Seasonality or changing interest | Search Console’s Last 16 months view, which the debugging guide recommends, then Google Trends |
| Impressions steady, clicks down | Any | A weaker title or snippet, or a richer result above yours | The debugging guide’s section on drop patterns |
The FAQ row matters mainly to government and health sites. Since Google’s August 2023 change, FAQ rich results have been shown regularly only for “well-known, authoritative government and health websites”, so a site outside those two groups had little FAQ appearance data left to lose on 7 May 2026.
The September 2025 num=100 Drop Left the Same Pattern
Search Engine Roundtable reported on 18 September 2025 that many sites were seeing “a noticeable decline in desktop impressions, resulting in a sharp increase in average position” after the num=100 change. A Google spokesperson’s statement to the site was “The use of this URL parameter is not something that we formally support.” The num=100 change and the 2026 logging-error fix both cut reported impressions and lifted average position, so check the date first and the device split second, since the num=100 fall showed in desktop impressions. This property cannot show the num=100 change: it earned 30 impressions in the whole of September 2025.
The Search Console Logging Error, Dated
Google has reworded this entry at least twice since posting it on 3 April 2026:
| Date | What happened | Source |
|---|---|---|
| 13 May 2025 | First day of affected data | Data anomalies page |
| 3 April 2026 | Google posts the entry, saying the issue “will be resolved over the next few weeks” and that “Clicks and other metrics were not affected by the error” | Search Engine Roundtable, 6 April 2026, quoting Google’s original wording |
| 27 April 2026 | Last day of affected data | Data anomalies page |
| By 28 April 2026 | The entry says “Only impressions and CTR are affected; clicks and other metrics were not affected by the error” | Wayback Machine snapshot of the Data anomalies page, 28 April 2026 |
| 2 May 2026 | Glenn Gabe posts that Google “said the impressions bug has been resolved”, adding “when I’m checking impressions across accounts, I’m not seeing any changes” | Gabe on Bluesky |
| 3 May 2026 | Asked by Barry Schwartz whether it was “fixed going forward but the past data won’t be fixed?”, John Mueller replies “Yes” | Mueller on Bluesky |
The entry as it reads on 30 September 2026, under the heading “April 3”:
A logging error prevented Search Console from accurately reporting impressions from May 13, 2025 until April 27, 2026. This issue has been resolved. As a result, you may notice a decrease in impressions in the Search Console Performance report. Only impressions and related metrics - CTR and average position - were affected; clicks were not affected by the error, and this issue affected data logging only.
The current wording changes how you read your own chart:
- The first version said clicks “and other metrics” were unaffected. By 28 April the entry named impressions and CTR as affected, and the current one adds average position, which covers a jump in position as well as a fall in impressions.
- None of these versions uses the word “inflated”. That word comes from Glenn Gabe’s Search Engine Roundtable headline, “GSC Logging Error Yielded Inflated Impressions Since May 2025”. Google’s own statement of direction stops at the fix: “you may notice a decrease in impressions”.
- Mueller’s answer explains what Gabe saw: the days before 28 April keep the numbers logged at the time. My export from 3 September 2026 still shows the step, so one Search Console chart now holds data logged with and without the error.
Did the Logging Error Cause the Great Decoupling?
One property cannot answer that. Gabe raised it in a post quoted in the same Search Engine Roundtable article, asking whether the error could have “caused some of the alligator graphs we have seen”. He describes the decoupling as the point where impressions surged while clicks fell, a gap he says most people attributed to AI Overviews. My own gap narrowed across the date, because impressions fell while clicks held; the CTR row in the window table below shows it.
One Site’s Google Search Console Impressions Drop, Day by Day
- Source: this property’s daily Chart export from the Performance report, covering 1 May 2025 to 31 August 2026, downloaded on 3 September 2026.
- Windows: the 14 days before 27 April against the 14 days after it. I left 27 April out, since it is the last affected day and its position sits between the two levels.
- Weighting: each window’s average position is weighted by daily impressions, which follows Google’s description of the metric as averaging “the position value for all impressions”.
| Metric | 13-26 April 2026 | 28 April-11 May 2026 | Change |
|---|---|---|---|
| Impressions | 21,428 | 13,973 | -34.8% |
| Impressions per day | 1,530.6 | 998.1 | -34.8% |
| Clicks | 10 | 9 | -1 |
| CTR | 0.047% | 0.064% | +38% |
| Average position, weighted by impressions | 38.2 | 14.0 | 24.2 places better |
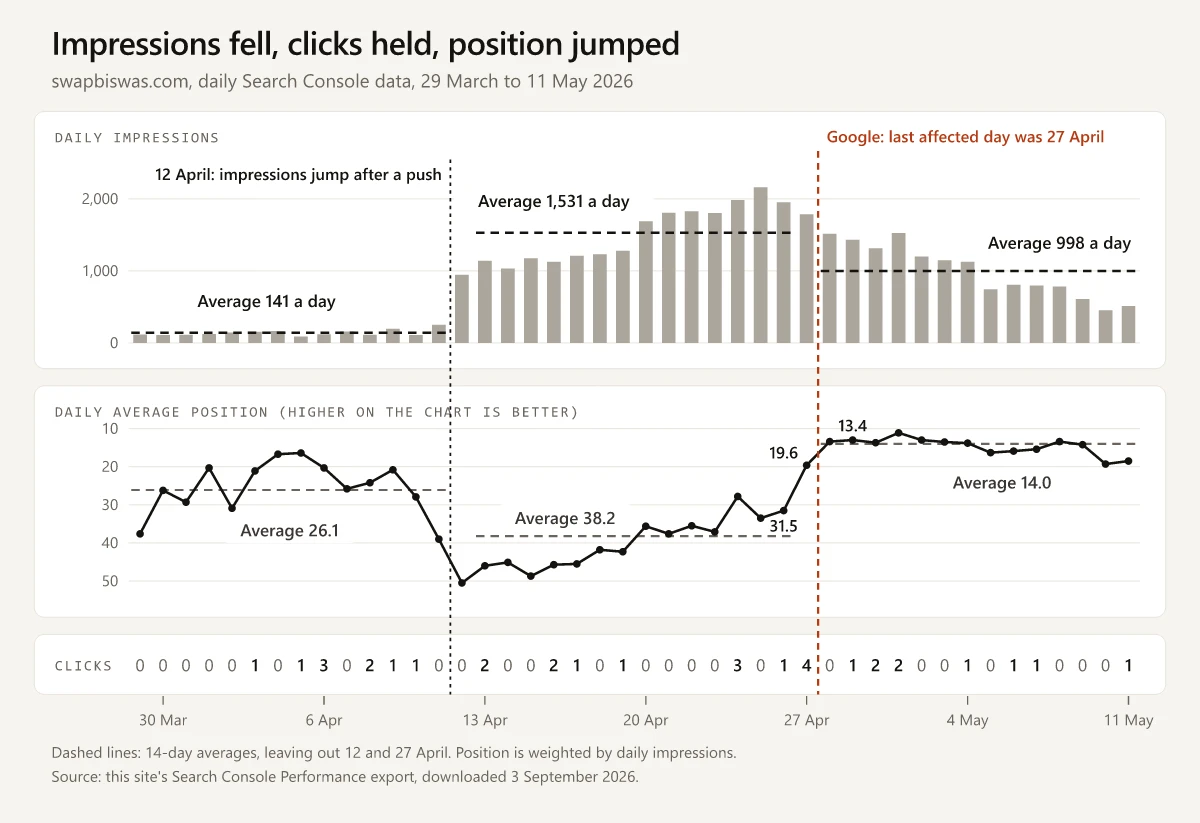
The position series carries most of the evidence:
- No day in the 14 before 27 April had an average position better than 27.8. All 14 days after it sat between 11.1 and 19.3.
- From 12 April, the first day this property passed 900 impressions, to 31 August 2026, the 18.1-place move between 26 and 28 April is the biggest two-day change in average position in either direction.
- The next biggest improvement that does not include 27 April is 9.8 places, from 24 to 26 May.
- Since 1 April, only the jump that set up the window moved further: average position worsened by 18.2 places from 9 to 11 April and by 22.6 from 10 to 12 April, while daily impressions rose from 197 on 9 April to 948 on 12 April.
A calendar-month report makes the drop look bigger. April 2026 carried 30,057 impressions and May 17,561, a fall of 41.6%, while clicks went from 26 to 19 on a site earning less than one a day.
My Own Deploys Point the Other Way
Search Console counts days in Pacific time, so these dates are Pacific too, taken from the push history of the repository this site deploys from. Nothing was pushed between 26 April and 10 May, the stretch that holds the step.
| Date | What went live | What I would expect it to do to impressions |
|---|---|---|
| 11 April | 3 new posts, the blog category pages and an llms.txt file | Raise them |
| 18 April | 5 new posts, a blog template change and edits to other pages | Raise them |
| 19 April | A site-wide footer linking recent posts and category pages, plus structured-data changes | Raise them, if anything |
| 20 April | noindex on the blog category pages, and their removal from the sitemap | Lower them slowly; those URLs hold 31 impressions in the whole 16-month export |
| 22 April | An ad script in every page’s head | Nothing, since no content or robots rule changed |
| 25 April | 5 new posts and an ads.txt file | Raise them |
| 26 April | 3 tool pages and a tools index, a Tools link in the navigation and footer, trailing slashes on blog card links, tool links added to 4 posts | Raise them |
| 10 May | 6 new posts, a blog template change and analytics scripts | Raise them, late in the window |
A new page that ranks deep adds impressions at worse-than-average positions, so any effect from the posts and tools would have worsened average position, the opposite of what happened on 28 April. The 20 April noindex waits on Google to recrawl each page, which the debugging guide says brings “a slower drop in traffic”, not a one-day step.
Impressions and clicks are weaker evidence than the position series, which is why the data is consistent with a reporting change without proving one:
- The 14 days before the step were not a quiet baseline. They began the day after the 12 April jump, which followed the 11 April push in the deploy table. The 14 days to 11 April, 11 of them inside the March 2026 core update, averaged 140.9 impressions a day at 26.1, with 9 clicks. Clicks sat at 9 or 10 a fortnight through the rise and the step, and position after 28 April sat better than before the jump (14.0 against 26.1).
- Impressions did not fall in one step. Seven days either side of 27 April, a span that stops before a second fall on 5 May, they went from 1,889.9 to 1,322.9 a day (-30.0%), while clicks went from 4 to 6 and average position from 33.9 to 13.0. No ranking update was running on Google’s dashboard on 5 May, so I cannot assign the whole 34.8% to the fix.
- Clicks are too few to prove much. Ten against nine fits a reporting change, but a real 35% loss would have cost three or four clicks over 14 days, a gap that daily counts of zero to three can hide.
- The fall kept going after the window. The 14 days from 12 May averaged 427.9 impressions a day at 20.0, with 4 clicks. Most of that slide came before 21 May, when the May 2026 core update began; its last five days sit inside that rollout. A slide over weeks is the slower pattern described in the next section, so I credit Google’s fix with the step on 28 April and leave the later slide unexplained.
Why Average Position Improves When Impressions Drop
Because Search Console averages position over every impression, removing a batch of low-ranked impressions improves the average even though no page moved. On the simplest reading of my two windows, where the impressions that stayed kept their positions, the 7,455 that disappeared averaged about position 83.5. Positions worse than 20 produce almost no clicks on this site, so losing them left the clicks line where it was.
The same arithmetic fits a real loss deep in the results, the second row of the table above. Timing separates the two readings: a reporting change hits on one day, while a loss that waits on Google recrawling your pages builds over days or weeks. Check the first day of your drop against the Data anomalies page and the search news for that week.
To judge the cleaned-up figure, see what a good average position in Search Console looks like; for why it is a date-range average rather than a daily rank, see the average position step in my ranking-check guide.
How to Check Your Own Drop in Search Console
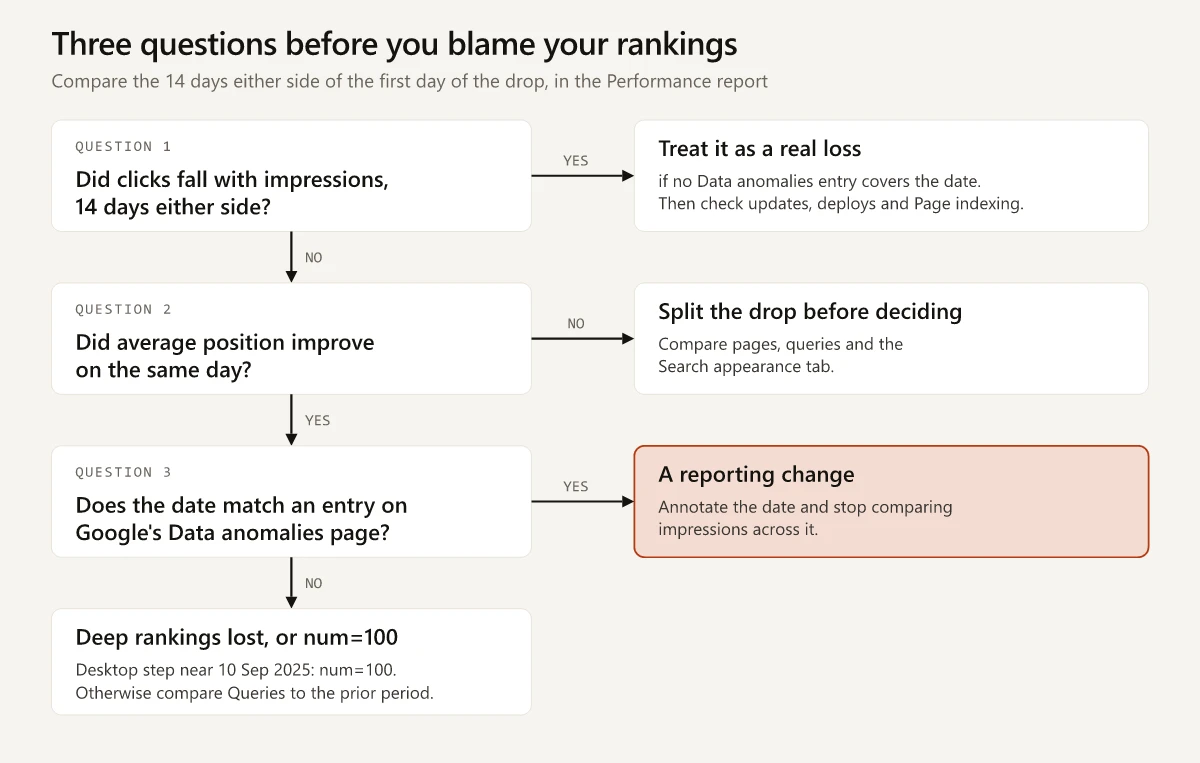
- In Performance, set the date range to Last 16 months, as the debugging guide recommends, so a drop that recurs every year shows itself, and switch on all four metrics.
- Find the first day of the drop. Compare average position that day with the week before, and compare clicks over the 14 days after it with the 14 days before it, leaving the day itself out.
- Read every entry on the Data anomalies page whose dates cover that day, in both the Performance and Rich result reports sections. Then run the three questions in the chart above.
- Open the Devices and Search appearance tabs. A fall concentrated in desktop from around 10 September 2025 fits the num=100 change, and a fall concentrated in FAQ from 7 May 2026 is the rich result removal.
- If a core or spam update overlaps the date, run the four update-window checks I use for Google’s spam updates before blaming it.
- Open the Page indexing report. Google’s troubleshooting advice for a drop in indexed pages is to “Look for a spike in non-indexed URLs that corresponds to your drop in indexed pages.”
- Right-click the Performance chart, choose “Add annotation” and mark the date. Custom annotations take up to 120 characters, and everyone with access to the property can see them.
Year-Over-Year Comparisons Stay Broken Until April 2027
Google says clicks were not affected by this error, so click comparisons across 28 April are safe for it. Impressions, CTR and average position need care:
- For any day from 13 May 2026 to 27 April 2027, the same day a year earlier falls inside Google’s error window. A year-over-year impressions comparison in that stretch sets a corrected day against an affected one.
- The Last 16 months view, opened on 30 September 2026, puts about 11 affected months beside 5 corrected ones.
- A before-and-after test of your own change, such as a title rewrite or a migration, that straddles 28 April 2026 measures the fix along with your change.
- If you run a daily bulk export to BigQuery, add a column that flags rows dated before 28 April 2026.
Before You Act on a Google Search Console Impressions Drop
Look at the clicks line and the date before you touch a title or chase a ranking. If clicks held, average position improved and the date matches an entry on Google’s Data anomalies page, leave the pages alone. If clicks fell with impressions and no Data anomalies entry covers the date, work down the update, deploy and indexing rows of the table in that order, and scope an audit to the pages that lost clicks. A Google Search Console impressions drop that lines up with a published date needs one annotation.
Frequently Asked Questions
Why did my Search Console impressions drop but clicks stayed the same?
Usually because the lost impressions were not producing clicks. Google says a logging error affected impressions, CTR and average position from 13 May 2025 until 27 April 2026 while clicks were unaffected, so a drop from 28 April 2026 with steady clicks fits the fix. A desktop drop from around 10 September 2025 fits the num=100 change.
Is there a Google Search Console impressions bug?
There was. Google's Data anomalies page says: 'A logging error prevented Search Console from accurately reporting impressions from May 13, 2025 until April 27, 2026.' The entry now says the issue has been resolved and that you may notice a decrease in impressions.
Will Google correct past Search Console impressions data?
Not according to John Mueller of Google. Asked on 3 May 2026 whether the fix applied going forward while past data stayed as it was, he replied 'Yes', so days before 28 April 2026 still carry the logging error.
Why did my average position improve when impressions dropped?
Search Console averages position over every impression, so when low-ranked impressions leave the report the average improves without any page moving. On this site the daily figure went from 31.5 on 26 April 2026 to 13.4 on 28 April.
Why did FAQ impressions drop in Search Console?
Google's Data anomalies page says that as of 7 May 2026, FAQ rich results are no longer appearing in Google Search, so reported FAQ impressions fall. Since August 2023 they had been shown regularly only for well-known, authoritative government and health websites.