Sales Enablement KPIs: 12 Metrics That Move Revenue (2026)
The sales enablement KPIs that prove your work moves revenue, not activity. 12 metrics across content, training, and deal support that actually matter.

The fastest way to lose your enablement budget is to report on activity. I have watched smart teams walk into a QBR with a slide that says “we shipped 38 assets and trained 120 reps this quarter,” and watched the CRO’s eyes glaze over before the second bullet. Nobody funds output. They fund outcomes, which is exactly why your sales enablement KPIs have to connect to revenue, not to how busy you were.
The problem is that enablement sits one step removed from the close. A rep wins the deal, not the battlecard. So the work of measuring enablement is really the work of proving influence, and that takes a deliberate mix of metrics. This post covers the 12 sales enablement KPIs I actually trust, what each one is secretly telling you, and the traps that make most enablement dashboards lie.
The stakes are bigger than a dashboard. Salesforce’s State of Sales report found reps spend just 28% of their week actually selling, with the rest lost to admin and internal busywork. Good enablement exists to move that number, so the right sales enablement KPIs measure whether you are giving reps more time and better odds in front of buyers, not how much content you shipped.
Why Most Sales Enablement KPIs Measure the Wrong Thing
Most enablement dashboards measure what is easy to count instead of what is hard to move. Assets published. Hours of training delivered. Number of battlecards live. These are real numbers, and they are almost completely useless as sales enablement KPIs because none of them tell you whether a single rep sold more.
I think of every metric as falling into one of three buckets. Activity is what you did. Adoption is what reps did with it. Outcome is what changed in the business. Activity metrics are fine for internal project tracking and terrible for proving impact.
The trap is that activity is satisfying. It is fully within your control, it always goes up, and it makes a tidy slide. Adoption and outcome metrics are messier, slower, and sometimes embarrassing, which is exactly why they are the ones worth reporting.
Leading vs Lagging Indicators
Every metric also sits somewhere on a timeline. Leading indicators predict the future and respond quickly. If content usage spikes this week, you will likely see it in pipeline later. Lagging indicators confirm the past and move slowly. Win rate does not change because of one good battlecard in one quarter.
| Metric type | Example | Speed to move | Best used for |
|---|---|---|---|
| Activity | Assets shipped, training hours | Immediate | Internal project tracking only |
| Leading adoption | Content usage, rep confidence | Days to weeks | Coaching and fast course-correction |
| Lagging outcome | Win rate, ramp time, deal size | A quarter or more | Proving impact to leadership |
The mistake I see most often is reporting only lagging metrics to leadership and only activity metrics to yourself. Flip it. Watch leading indicators weekly so you can adjust, and bring lagging outcomes to the quarterly review where they belong.
The 12 Sales Enablement KPIs That Actually Prove Impact
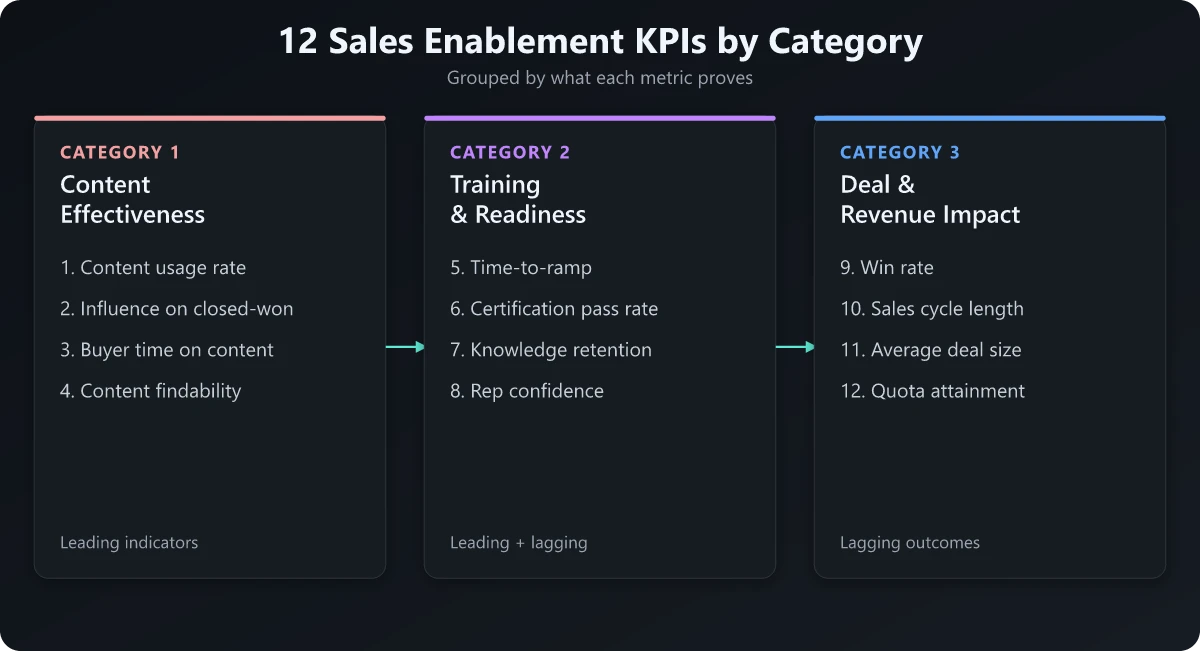
Here are the twelve I come back to. I have grouped them by what they measure, because a dashboard with all twelve and no structure is just noise.
Content Effectiveness KPIs
1. Content usage rate. What share of published assets actually get opened, sent, or presented by reps? A library where most of the content is never touched is not a content problem, it is a discoverability or relevance problem. This is the first metric I check because it exposes waste fast.
2. Content influence on closed-won. This is the one that earns budget. Of the deals that closed, how many had a rep engage a key enablement asset along the way? You are not claiming the asset closed the deal. You are showing that your content shows up in winning motions far more than in losing ones.
3. Time spent on shared content (by the buyer). Modern enablement and sales platforms can show how long a prospect actually spent inside a deck or one-pager a rep shared. Low engagement on a heavily used asset means the content is wrong, not the rep. If you want the system side of this, I broke it down in what is sales enablement software.
4. Content findability. How long does it take a rep to find the right asset, and how often do they give up and make their own? Shadow content (reps building their own decks because yours are buried) is a silent killer that no usage report shows directly. Ask reps; do not assume.
Training and Readiness KPIs
5. Time-to-ramp. How long until a new rep hits full productivity, usually defined as first closed-won or first quota-attainment month. If your enablement program is working, this number trends down. It is the single cleanest proof that onboarding content earns its keep.
6. Training completion and certification pass rate. Completion alone is weak (people click through). Pair it with a certification, like a recorded mock demo or a written objection-handling test, and you get a real readiness signal. The gap between “completed” and “passed” tells you whether the training actually landed.
7. Knowledge retention over time. A rep who passes a product certification in week 6 and cannot answer the same questions in month 6 did not learn, they crammed. Spot-check retention with periodic refreshers and short assessments. This is where most onboarding programs quietly fail.
8. Rep confidence (self-reported). A quick recurring survey, where reps rate their confidence handling the top objections or pitching a specific product, is one of the most underrated sales enablement KPIs there is. It is a leading indicator you can move in a week, and low confidence almost always precedes low win rate.
Deal and Revenue Impact KPIs
9. Win rate. The headline lagging metric. Track it overall, but the real insight is in the splits: win rate for reps who completed a given training versus those who did not, or for deals that used a battlecard versus those that did not. The comparison is the story.
10. Sales cycle length (deal velocity). Good enablement removes friction, and friction shows up as time. If a new objection-handling guide or a tighter pitch shortens the average cycle, that is enablement showing up in the metric revenue leaders feel most.
11. Average deal size. Enablement that improves discovery and multi-threading tends to grow deal size, not just close rate. If you ship a value-messaging framework or a pricing-conversation guide, this is where to look for the lift. My pricing strategy playbook pairs well with this one.
12. Quota attainment distribution. Do not just track the average. Look at the shape: what share of reps hit quota, and is the middle of the pack rising? Great enablement lifts the median rep, not the already-great ones. A rising middle is the clearest sign your program scales beyond your top performers.
How to Build a Sales Enablement KPI Dashboard
A list of metrics is not a measurement system. Here is the sequence I use to turn these twelve into something a revenue leader will actually act on.
- Start with the business outcome leadership already cares about. Usually win rate, ramp time, or deal velocity. Pick one. That is your North Star lagging metric.
- Pick the two or three leading indicators that move it. If the goal is win rate, your leading metrics might be battlecard usage and rep confidence on competitive objections.
- Instrument the connection. You cannot measure content influence on closed-won without your enablement platform and CRM talking to each other. Sort this out before you promise the number.
- Set a baseline before you change anything. A KPI without a before-state is just a number. Capture the starting point so you can show movement.
- Segment everything. New reps versus tenured. Used the asset versus did not. Completed the training versus skipped it. The aggregate hides the insight; the split reveals it.
- Report leading weekly, lagging quarterly. Match the review cadence to how fast each metric actually moves.
The Attribution Trap (and How I Handle It)
You will be asked to prove enablement “caused” a result. You usually cannot, not cleanly, because reps, marketing, product, and timing all touch the same deal. Anyone who claims a precise enablement ROI figure is guessing with confidence.
So I report influence, not causation. The honest framing is comparative: reps who completed this certification close at a noticeably higher rate than those who did not, and deals that engaged this asset move through pipeline faster than those that did not. That comparison, repeated across enough deals, is persuasive without being dishonest. It is the same logic behind a good win-loss analysis, where the pattern across many deals matters more than any single one.
Tie KPIs Back to the Enablement Plan
KPIs are downstream of a plan. If you have not yet mapped what content and training you owe the sales team, the metrics have nothing to measure. Start with the sales enablement strategy build order, then instrument it. My sales enablement checklist covers the deliverables across onboarding, launch, and competitive that these KPIs are meant to evaluate.
And remember that enablement does not start at the close. The quality of the pipeline reps are working shapes every one of these numbers. If your B2B demand generation is filling the funnel with poorly-fit leads, even perfect enablement will show weak win rates. Measure enablement in the context of the pipeline it inherits.
Common Mistakes That Make Enablement KPIs Lie
A few patterns quietly corrupt enablement dashboards. I have made most of these myself.
Vanity over value. Reporting assets shipped and training hours because they always go up. They prove effort, not impact, and seasoned leaders see through them.
No baseline. Announcing that win rate is 31 percent means nothing without knowing what it was before and what it is for reps who skipped your program. A number with no comparison is not a KPI, it is trivia.
Measuring completion, not competence. A 100 percent training completion rate next to reps who still fumble the top objection is a measurement failure. Always pair completion with a readiness check.
Ignoring shadow content. If your usage metrics look low, the reps may not be lazy, they may be quietly building their own assets because yours are unfindable. The metric hides the real problem.
Over-claiming attribution. Presenting a precise revenue-impact figure you cannot defend. The first time a skeptical VP picks it apart, you lose credibility for every honest number after it.
Conclusion: Pick the KPIs You Can Defend
The point of sales enablement KPIs is not to fill a dashboard. It is to answer one question your CRO is always asking, whether out loud or not: does this function make us sell better? If your metrics cannot answer that, they are decoration.
So narrow it down. Choose one lagging outcome leadership already values, two or three leading indicators you can move this month, and report each on the cadence it deserves. Frame everything as influence and comparison rather than tidy causation, because the honest version of the story is more durable than the impressive one.
Activity metrics will always be easier to produce. Resist them. The enablement teams that keep their budget are the ones whose sales enablement KPIs point straight at revenue and survive a hard question. Build that dashboard, defend those numbers, and the rest of the conversation gets a lot easier.
Frequently Asked Questions
What are sales enablement KPIs?
Sales enablement KPIs are the metrics that show whether your enablement work (content, training, and deal support) actually helps reps sell more. They split into leading indicators like content usage and rep confidence, and lagging indicators like ramp time, win rate, and deal velocity.
What is the most important sales enablement KPI?
There is no single one. The honest answer is a pair: content influence on closed-won revenue tells you if your assets matter, and time-to-ramp tells you if your training works. Pick the lagging metric your revenue leaders already care about, then track the leading metrics that move it.
How do you measure the ROI of sales enablement?
Tie enablement activity to revenue outcomes. Compare win rate, deal size, or ramp time between reps who used a given asset or completed a given training and those who did not. The gap, applied across pipeline, is your directional ROI.
What is the difference between leading and lagging enablement metrics?
Leading metrics (content usage, training completion, rep confidence) predict future results and can be changed this week. Lagging metrics (win rate, ramp time, quota attainment) confirm results but take a quarter or more to move. You need both.
How often should you review sales enablement KPIs?
Review leading indicators weekly or biweekly so you can adjust content and coaching fast. Review lagging indicators monthly and quarterly alongside the revenue team, because they only show meaningful movement over longer windows.