4 Ps of Marketing Examples: Coca-Cola, Nike and 5 More
These 4 Ps of marketing examples fill in the grid for Coca-Cola, Nike, McDonald's, Apple, Figma, HubSpot and Slack, with every price dated and sourced.
A 4 Ps of marketing example is easiest to learn from when every cell holds something the company actually did. So before any definitions, this is Coca-Cola’s grid, built only from its second-quarter 2026 results and its page on how the Coca-Cola system works:
| P | Coca-Cola, as of September 2026 |
|---|---|
| Product | A drinks portfolio that includes Trademark Coca-Cola. In Q2 2026, Coca-Cola Zero Sugar unit case volume grew 16%, and Coca-Cola Zero Zero (zero sugar, zero calories, zero caffeine) is being extended to markets across Asia Pacific and Latin America |
| Price | Price/mix grew 2% in Q2 2026, “primarily driven by pricing actions in the marketplace, partially offset by unfavorable mix” |
| Place | 200+ bottling partners and 950+ production facilities get the drinks to people in over 200 countries. The company makes the concentrates and syrups; the bottlers mix, bottle and package the drinks and work with local businesses to get them to consumers |
| Promotion | One FIFA World Cup 2026 campaign across more than 180 markets, with retail programs in more than 20 million outlets and connected packaging that collected more than 25 million first-party data records |
The four rows, one line each:
- Product is what you sell: the range, the features, the packaging and the brand name on it.
- Price is what the buyer pays and how: list price, discounts, tiers, financing and the unit you charge for.
- Place is how the product reaches the buyer: stores, wholesale partners, distributors, your own website, or a sales team.
- Promotion is how buyers hear about it and get a reason to act: advertising, sponsorships, events, loyalty programs and trade-in offers.
A made-up example teaches that vocabulary. It cannot show what the four decisions look like when a company reports them to investors, where Place turns out to be a roughly 61/39 split between wholesale partners and the brand’s own channels (Nike), or more than 45,000 locations, about 95% of them run by independent owners (McDonald’s).
This page holds seven grids, four consumer brands and three B2B software companies, so they double as marketing mix examples of companies you can check yourself. Every figure in the grids comes from a page the company itself publishes, such as an earnings release, SEC filing, pricing page or online store, checked on September 26, 2026. Where a company does not publish a price I could verify, the grid describes the pricing strategy and leaves the number out.
I work in product marketing, so each grid ends with what it teaches, and a later section covers the part textbook grids skip: who inside a company owns each P.
What Are the 4 Ps of Marketing?
The 4 Ps are the four decisions a company makes to bring something to market: product, price, place and promotion. Together they are called the marketing mix. Neil Borden, an advertising professor at Harvard, popularized the marketing mix idea in the 1950s, and E. Jerome McCarthy, a marketing professor at Michigan State University, named them the four Ps and popularized them through Basic Marketing: A Managerial Approach, a 1960 textbook (Investopedia).
One naming collision catches people. The marketing mix in this sense is a plan. Marketing mix modeling is a statistical method for estimating which channels drove sales, a separate subject covered in marketing mix modeling vs attribution.
4 Ps of Marketing Examples From Consumer Brands
Each grid is dated, because prices and channel splits move every quarter, and its sources are linked just above the table.
Coca-Cola: Most Bottlers Are Independent
The grid at the top of this page is Coca-Cola’s. Three details in it are easy to misread:
- The Price row is a company-level number. Organic revenue grew 6% in Q2 2026, from a 4% rise in concentrate sales and 2% price/mix growth, per the Q2 release. That is a different number from the shelf price a shopper sees.
- The Place row is a partner network. Coca-Cola says it “does not own, manage or control most local bottling companies.”
- The Promotion row is measurable. The World Cup digital and social activations generated more than 60 billion impressions and over 9 billion views, supported by more than 2,500 content creators, and the company says the campaign contributed to a portion of Trademark Coca-Cola’s 5% volume growth in the quarter.
Coca-Cola also runs a portfolio of separately named drinks, which is why its Product row reads like a brand architecture chart. The house of brands vs branded house breakdown covers that side.
What this teaches: when partners run Place, the brand owner’s own part of the work narrows to the product and the marketing. Coca-Cola describes its role as creating “the concentrates and syrups” and shaping “the marketing that brings these drinks to life,” while Price still moves at company level through the 2% price/mix line above.
Nike: Wholesale Grew While Nike Direct Shrank
The figures come from the NIKE, Inc. fiscal 2026 results for the year ended May 31, 2026. The prices come from Nike’s US product pages for two colorways of the men’s Air Force 1 ‘07 (a $115 colorway and a $130 colorway) and for the Air Force 1 Low By You.
| P | Nike, as of September 2026 |
|---|---|
| Product | Three brands under NIKE, Inc.: Nike, Jordan and Converse. Converse revenue fell 31% to $1.2 billion in fiscal 2026, while CEO Elliott Hill said the company is “encouraged by progress in performance product” |
| Price | Premium list prices with a paid custom tier. A men’s Air Force 1 ‘07 lists at $115 to $130 depending on colorway, and a customizable Air Force 1 Low By You lists at $140 |
| Place | Wholesale revenue $27.5 billion, up 6%. NIKE Direct $17.7 billion, down 6%, with NIKE Brand Digital down 12%. Wholesale was about 61% of the $45.2 billion NIKE Brand total |
| Promotion | $4.8 billion of demand creation expense, up 1%, which Nike attributes to higher sports marketing expense and currency changes, partly offset by lower brand marketing. That is about 10% of the $46.4 billion in total revenue |
What this teaches: Place moves. A grid that says only “Nike sells direct through its own stores and app” misses where most of the money went in fiscal 2026: through retail partners, in the one channel that grew. The CFO listed “investing in marketplace elevation” among the company’s current priorities.
McDonald’s: Independent Owners Run About 95% of Restaurants
The figures come from McDonald’s Q2 2026 results, the quoted language from the risk factors in the Q2 2026 supplemental information filed with the SEC, and the menu names from McDonald’s US menu page.
| P | McDonald’s, as of September 2026 |
|---|---|
| Product | A core menu, which the filing lists among the things its strategies depend on: “committing to our core menu items.” Featured favorites on the US menu page include the Big Mac, 4 Piece Chicken McNuggets and the Quarter Pounder with Cheese |
| Price | Value tiers with no published prices. The US menu page has a McValue section and Extra Value Meals but shows no prices, and the filing says McDonald’s competes “primarily on the basis of product choice, quality, affordability, service and location.” It expects pricing strategies and “the value proposition they represent” to remain “important components of our business strategy” |
| Place | Over 45,000 locations in over 100 countries, about 95% of them owned and operated by independent local business owners, plus drive thru, delivery and digital ordering. The filing says success relies on franchisees and affiliates being willing “to remain aligned with us on operating, value/promotional and capital-intensive reinvestment plans” |
| Promotion | Loyalty at scale. Across 70 loyalty markets, sales to loyalty members reached $40 billion over the trailing twelve months, up more than 20%, with nearly 220 million 90-day active users |
What this teaches: in a franchise system, most customers see a Price or Promotion plan only if independent owners carry it out, and McDonald’s own filing lists that alignment among the things its success relies on.
Apple: A $1,300 Spread Across the iPhone Line
The prices and offers below are from Apple’s US online store as displayed on September 26, 2026, using the “Buy from” price for each model, and the iPhone Duo dates from Apple’s iPhone Duo page.
| P | Apple iPhone, as of September 2026 |
|---|---|
| Product | Six iPhone lines on Apple’s US store: iPhone 16, iPhone 17e, iPhone 17, iPhone Air, iPhone 18 Pro and Pro Max, and a new iPhone Duo, with pre-orders opening October 16, 2026 |
| Price | A ladder: $699 (17e), $799 (16), $899 (17), $1,099 (Air), $1,199 (18 Pro) and $1,999 (Duo). The iPhone 16 and iPhone 17 prices each include a $30 connectivity discount that needs carrier activation. Monthly installments and leasing through Apple Upgrade sit on top |
| Place | Apple’s online store, Apple Store locations, a “Connect with a Specialist” option, and carrier deals with AT&T, T-Mobile and Verizon |
| Promotion | Pre-order windows for new models, Apple trade-in credit of $175 to $885 toward an iPhone Duo or iPhone 18 Pro for an iPhone 13 or newer, and separate carrier deals worth up to $1,200 in credit on a new iPhone after trade-in (AT&T and T-Mobile; up to $1,020 with Verizon) |
What this teaches: “premium pricing” is too thin a label for Apple’s Price row. The line runs from $699 to $1,999, and what a buyer pays depends on trade-in credit and monthly terms as well as the headline number.
Marketing Mix Examples of Companies in B2B SaaS
Software changes two rows. Price gains a unit (per seat, per contact, per credit), and Place is usually some mix of self-serve signup, a sales team and a partner network, with no shelf involved. The method behind choices like these is in how to create a pricing strategy; the grids below only record what three companies chose.
Figma: Three Seat Types on Every Paid Plan
The plan details come from Figma’s pricing page and the event dates from the Config site.
| P | Figma, as of September 2026 |
|---|---|
| Product | Nine products in the plan picker on Figma’s pricing page: Figma Design, Figma Make, Figma Draw, Dev Mode, FigJam, Figma Slides, Figma Motion, Figma Sites and Figma Buzz. The site’s product menu also lists Figma Weave |
| Price | A free Starter plan, then per-seat pricing by role. On Professional billed annually, a Full seat is $16 a month, a Dev seat $12 and a Collab seat $3; billed monthly, the same seats cost $20, $15 and $5. Organization and Enterprise list annual billing only, with Full seats at $55 and $90. Every seat carries a monthly allowance of AI credits |
| Place | Self-serve in the browser for Starter, Professional and Organization, each with a “Select plan” button that leads to signup or checkout, and “Contact sales” for Enterprise |
| Promotion | Config, Figma’s conference for people who build products (June 23-25, 2026, with recordings online), and its first-ever Config India on October 15, 2026, free to join virtually |
What this teaches: the unit you charge for is a Price decision and a Product decision at once. A team’s Figma bill depends on who designs, who builds and who only works in FigJam, Figma Slides or Figma Buzz, while people who just view and comment need no paid seat. That structure is picked apart in B2B SaaS pricing psychology.
HubSpot: Seats, Contacts, Credits and an Onboarding Fee
The plan structure comes from HubSpot’s Marketing Hub pricing page, the channel detail from its partner page and the event from the UNBOUND site.
| P | HubSpot Marketing Hub, as of September 2026 |
|---|---|
| Product | Marketing Hub in Free, Starter, Professional and Enterprise editions, plus a new HubSpot AEO product that shows how a business appears in ChatGPT, Gemini and Perplexity |
| Price | Free for up to 2 users. Starter is priced per seat. Professional includes 3 Core Seats and Enterprise includes 5, and both require a one-time onboarding fee. Each tier also sets the marketing contacts included (1,000 on Starter, 2,000 on Professional, 10,000 on Enterprise) and the HubSpot Credits included (500, 3,000 and 5,000). The page shows prices in local currency, so this grid leaves the numbers out |
| Place | ”Buy now” self-serve on Starter, “Talk to Sales” on every paid tier, and a Solutions Partner Program for “service firms, consultancies, and agencies” that serve mid-market and enterprise customers |
| Promotion | HubSpot’s flagship event, renamed from INBOUND to UNBOUND after fifteen years. UNBOUND 2027 runs September 8-10, 2027 in Boston; the page listed a $1,699 General Admission Pass for a presale that has sold out, with registration reopening on Cyber Monday |
What this teaches: a B2B Price row often has three parts: the subscription, the usage allowances and a one-time services fee. A grid that lists only the monthly price understates the first-year cost.
Slack: The Free Plan Does the Promotion
Everything in this grid is from Slack’s pricing page.
| P | Slack, as of September 2026 |
|---|---|
| Product | Messaging, huddles, canvases, lists and workflow automation, with AI that deepens by tier: “Basic AI” on Free and Pro, “Advanced AI” on Business+ and “Enterprise-grade AI” on Enterprise+. The Slack App Directory lists over 2,600 apps, and Agentforce brings Salesforce agents into Slack (Slack is “a Salesforce company”) |
| Price | Free forever, with 90 days of message history and up to ten apps. Pro and Business+ are priced per user per month and cost less when paid yearly. Enterprise+ is quoted by sales |
| Place | Self-serve signup (“Get started”) for Free, Pro and Business+, and a sales team for Enterprise+ (“Contact sales”) |
| Promotion | The Free plan itself. Huddles and Slack Connect are 1:1 only on Free, so a team that wants group calls or shared channels with other companies has a reason to upgrade |
What this teaches: in product-led software, part of the promotion job is done by free usage, and the Free plan’s limits carry the conversion argument. More cases like this are in product-led growth examples.
The Owner of Each P Inside a Company
A grid on a slide makes the four Ps look like one plan written by one person. In a software company they are often decided by different groups, and the grid only holds together if someone keeps them consistent. This is the split I would expect:
- Product: product management and engineering decide what ships. Product marketing brings the market input, such as which segment to serve and which competitor to beat, the work behind product positioning.
- Price: finance and product leadership set the numbers. Product marketing usually shapes the packaging and the price story, such as which features sit in which tier and how the tiers are named, as in good-better-best pricing.
- Place: sales and partnerships own the channels. Product marketing equips them, for example with a battlecard for each main competitor.
- Promotion: brand and demand generation run the campaigns. Product marketing writes the positioning and messaging those campaigns draw from.
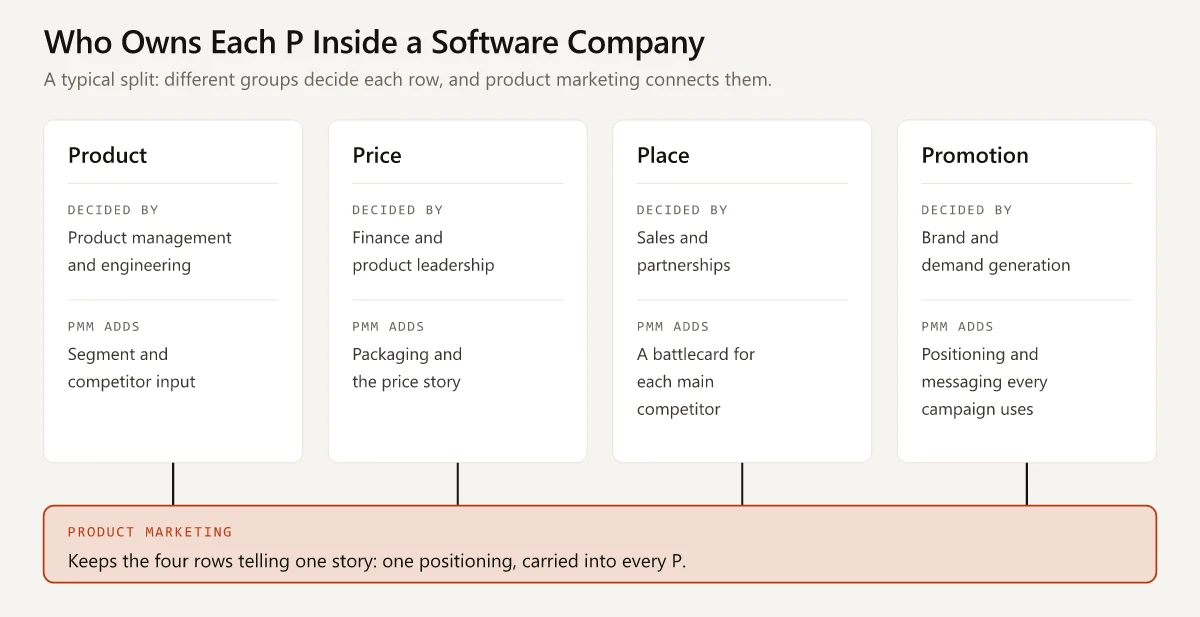
The failure to check for first is a mismatch between rows: a premium Price row next to a Promotion row built on discounts, or a partner channel that never received the positioning. For how that connecting role fits the rest of the job, see what product marketing is.
4 Ps vs 7 Ps of Marketing
The 7 Ps keep the original four and add people, process and physical evidence. Bernard Booms and Mary Jo Bitner proposed the extension in 1981 so the marketing mix could be applied to service companies (Toolshero). Applied to McDonald’s, the three extra rows look like this:
| Extra P | What it covers | McDonald’s |
|---|---|---|
| People | The staff and partners who deliver the service | Restaurant crews and the independent owners who run about 95% of locations |
| Process | How the service is delivered, step by step | Ordering at the counter, at the drive thru, through delivery and through mobile order and pay |
| Physical evidence | What the customer sees and touches that signals quality | The restaurant, the packaging and the app |
Use the 7 Ps when you sell a service or wrap one around a product. B2B software usually has one: onboarding and support are People and Process decisions, and HubSpot’s required onboarding fee on Professional and Enterprise is a Process decision with a price attached.
4 Ps vs 4 Cs
Bob Lauterborn’s 4 Cs, which Investopedia dates to 1990, rewrite each P from the buyer’s side: the consumer for product, cost for price, convenience for place and communication for promotion. They make a good check on a finished grid. Read each row again as the buyer and see whether it still holds.
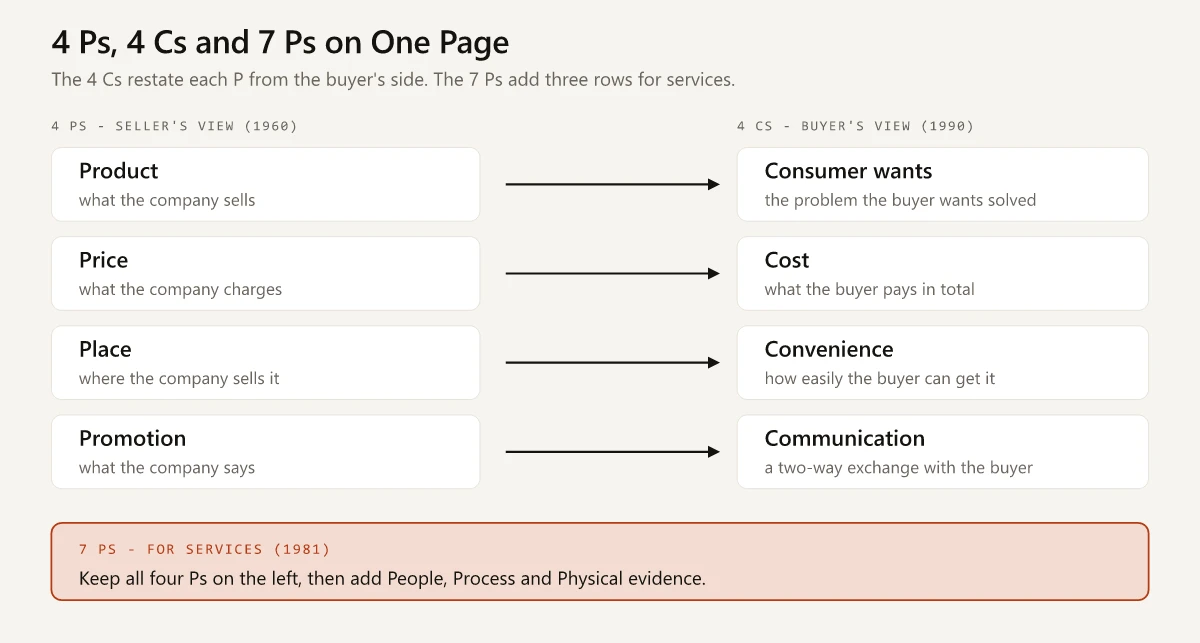
Apple’s grid shows why Cost and Price differ. The iPhone 18 Pro starts at $1,199, but a buyer trading in an iPhone 13 or newer and paying monthly faces a different cost from that list price.
How to Build a 4 Ps Grid for Any Company
Every grid above came from four kinds of public source. Use the same ones for a competitor teardown or your own product:
| P | Where to find it | What to record | Common miss |
|---|---|---|---|
| Product | The company’s brands or products page; for software, the plan list on the pricing page | Named product lines and what is new this year | Listing every SKU instead of the lines that carry revenue |
| Price | The official store or pricing page; the “price/mix” line in an earnings release | A dated list price, the unit charged for, discounts and financing | Writing “premium pricing” with no number and no date |
| Place | Channel lines in the earnings release (wholesale vs direct), the franchise share, the partner program page | The revenue split by channel | Assuming the brand sells mostly through its own stores |
| Promotion | Marketing commentary in the earnings release, event and sponsorship pages | One named campaign with a date and a reach figure | Quoting a slogan instead of a current campaign |
Public companies publish most of this every quarter. For a private company, the pricing page and the partner page do most of the work, and the channel split usually stays a description. If the grid is for your own product, attach each row to an owner and a date inside a SaaS go-to-market strategy.
Choosing a 4 Ps of Marketing Example to Study
Pick a 4 Ps of marketing example you can check against the company’s latest filing or pricing page, because the rows change: in fiscal 2026 alone, Nike’s wholesale revenue rose 6% while NIKE Direct fell 6%. Build your own grid with a date and a source in every cell, starting with the Place row.
Frequently Asked Questions
What is an example of the 4 Ps of marketing?
Coca-Cola, filled in from its own Q2 2026 results. Product: a drinks portfolio that includes Trademark Coca-Cola, where Coca-Cola Zero Sugar volume grew 16%. Price: price/mix up 2%, mainly from pricing actions, partly offset by mix. Place: 200+ bottling partners reaching over 200 countries. Promotion: one FIFA World Cup 2026 campaign across more than 180 markets.
What are the 4 Ps of marketing for Nike?
Product: the Nike, Jordan and Converse brands. Price: premium list prices, such as $115 to $130 for a men's Air Force 1 '07 on Nike's US store in September 2026, depending on colorway. Place: $27.5 billion of fiscal 2026 revenue came through wholesale and $17.7 billion through NIKE Direct. Promotion: $4.8 billion of demand creation expense.
What is the difference between the 4 Ps and 7 Ps of marketing?
The 7 Ps keep product, price, place and promotion and add people, process and physical evidence. Booms and Bitner proposed the extension in 1981 so the marketing mix would fit service businesses, where the staff, the delivery process and the physical setting are part of what the customer buys.
Who created the 4 Ps of marketing?
E. Jerome McCarthy, a marketing professor at Michigan State University, named the four Ps and popularized them in the 1960 textbook Basic Marketing: A Managerial Approach. He built on the marketing mix idea that Neil Borden of Harvard popularized in the 1950s.
What are the 4 Cs of marketing?
The 4 Cs are Bob Lauterborn's buyer-side version of the 4 Ps, from 1990: the consumer in place of product, cost in place of price, convenience in place of place, and communication in place of promotion.