SEO Report Example, Metrics, and Reporting Template
An SEO report example with real Search Console numbers, plus the metrics to track, a nine-section reporting template, and the free tools that build it.

Most businesses invest in SEO but can’t answer basic questions like “Which keywords are driving traffic?” or “Is our organic performance improving?” They publish content, build links, and tweak meta tags - but never build a system to track whether any of it works. Consider this: 96.55% of all content gets zero traffic from Google. The gap between doing SEO and measuring it is enormous - and without reporting, you have no way to know if you’re in the lucky 3.45% or not.
Understanding what is an SEO report - and how to build one that actually drives decisions - is the difference between running SEO on instinct and running it on evidence.
What Is an SEO Report?
An SEO report is a structured document that summarizes your website’s search engine optimization performance over a specific period. It pulls together data from multiple sources - Google Search Console, analytics platforms, rank trackers, and crawl tools - into a single view of what’s working and what isn’t.
A good SEO report answers three questions:
- Where are we now? Current organic traffic, rankings, and technical health.
- What changed? Trends compared to the previous period.
- What should we do next? Prioritized actions based on the data.
It’s not a data dump. The best SEO reports translate raw metrics into business context. “Organic traffic grew 12%” is data. “Organic traffic grew 12%, driven by three new blog posts targeting bottom-of-funnel keywords, generating 47 demo requests” is a report that gets people’s attention.
Why SEO Reports Matter
Accountability and Alignment
SEO is a long game. An Ahrefs study found that only 1.74% of newly published pages reach Google’s top 10 within one year - meaning most SEO work takes months before results appear. Without regular reporting, stakeholders lose patience because they can’t see progress. A monthly SEO report keeps everyone aligned on what’s happening, why, and what comes next.
It also protects you. When someone asks “What has SEO done for us lately?” - you have documented proof.
ROI Tracking
SEO often competes with paid channels for budget. Reports that tie organic traffic to conversions and revenue make the case for continued investment. According to BrightEdge research, organic search drives 53.3% of all trackable website traffic - more than paid search, social, and display combined. If you can show that organic search drives the majority of qualified leads at a fraction of the cost-per-acquisition of paid ads, the budget conversation gets much easier. Just make sure the paid side of that comparison is complete, because GA4 splits multi-network Google Ads traffic into a Cross Network row of its own and a report that counts only Paid Search will understate what paid actually cost.
Spotting Problems Early
A well-structured SEO report surfaces problems before they become crises. Google launched four core updates and three spam updates in 2024 alone, any of which could shift your rankings overnight. Before you pin a drop on one of them, compare it with your site’s normal week-to-week swing, the check I lay out for Google’s September 2026 spam update. A sudden drop in impressions, a spike in 404 errors, or declining Core Web Vitals scores all show up in the data before they hit your bottom line. For a deeper look at technical diagnostics, check out our guide on how to conduct a technical SEO site audit.
Key Metrics Every SEO Report Should Include
Not every metric belongs in every report. The table below covers the essential ones, organized by category, with what each metric actually tells you.
| Category | Metric | What It Tells You | Source |
|---|---|---|---|
| Traffic | Organic sessions | Total visits from search engines | GA4 |
| Traffic | Organic users (new vs. returning) | Audience growth and retention | GA4 |
| Visibility | Total impressions | How often your site appears in search results | GSC |
| Visibility | Average position | Overall ranking health | GSC |
| Engagement | Click-through rate (CTR) | How compelling your titles and descriptions are | GSC |
| Engagement | Bounce rate / Engagement rate | Whether visitors find what they need | GA4 |
| Keywords | Keyword rankings (tracked set) | Movement of your target keywords | Ahrefs / Semrush |
| Keywords | Keywords in top 3 / top 10 / top 100 | Distribution of ranking positions | Ahrefs / Semrush |
| Backlinks | Referring domains (new and lost) | Link building momentum | Ahrefs / Semrush |
| Technical | Core Web Vitals (LCP, INP, CLS) | Page experience health | GSC / PageSpeed Insights |
| Technical | Crawl errors and index coverage | Whether Google can access your pages | GSC |
| Conversions | Organic conversions / goal completions | Business impact of SEO | GA4 |
| Conversions | Organic revenue or lead value | ROI justification | GA4 / CRM |
Benchmark context matters. For example, Backlinko’s analysis of 4 million Google search results found that the #1 organic result gets a 27.6% CTR - 10x more than position #10. A FirstPageSage study (updated 2025) puts the spread even wider: 39.8% CTR for position 1 versus just 1.6% for position 10. Including benchmarks like these in your report helps stakeholders understand why a ranking improvement from #8 to #3 isn’t just a vanity win - it can multiply your traffic.
Pro tip: Don’t include every metric for every audience. Executives care about traffic, conversions, and revenue. Your SEO team needs the granular keyword and technical data. Tailor the report to the reader.
Types of SEO Reports
Different situations call for different report formats. Here are the four most common.
Monthly SEO Report
The workhorse of SEO reporting. Covers the past 30 days compared to the prior month and the same month last year. Includes traffic, rankings, backlinks, technical issues, and key actions taken.
Best for: Ongoing SEO management, client reporting, team alignment.
Quarterly SEO Report
A higher-level view that aggregates three months of data to show trends. Focuses on strategic progress - are we hitting our annual goals? How is organic share-of-voice changing? If you need to make the case for deeper diagnostic work to leadership, our guide on why an SEO audit is important explains the business value.
Best for: Executive stakeholders, board presentations, budget planning.
Technical SEO Audit Report
A deep-dive into your site’s technical health - crawlability, indexation, site speed, structured data, and internal linking. This isn’t a recurring report; it’s triggered by specific needs (site launch, redesign, performance drop). Running through an SEO audit checklist first gives you the raw findings this report section is built from.
Best for: Development teams, migration planning, troubleshooting ranking drops. See our full technical SEO audit guide for the complete checklist.
Competitor SEO Report
Analyzes how your organic performance stacks up against specific competitors. Covers share-of-voice, keyword overlap, content gaps, and backlink comparison.
Best for: Strategy planning, identifying quick wins, executive buy-in.
How to Create an SEO Report Step by Step
Step 1: Define Your Audience and Goals
Before pulling any data, answer two questions:
- Who is reading this report? (CMO, client, development team, your own notes)
- What decisions should this report inform? (Budget allocation, content priorities, technical fixes)
These answers determine which metrics to include, how much detail to provide, and what language to use. A report for a developer needs different context than one for a VP of Marketing.
Step 2: Pull Your Data Sources
Gather data from your core tools:
- Google Search Console for impressions, clicks, CTR, average position, and index coverage. Note that GSC retains performance data for 16 months, so export your data regularly if you need longer historical comparisons.
- Google Analytics 4 for organic sessions, user behavior, and conversions
- Ahrefs or Semrush for keyword rankings, backlink profile, and competitor data
- Screaming Frog for technical crawl data (if including a technical section)
If a reader asks how often Googlebot fetches a specific URL, none of those sources answers it. That question needs a raw access log, and on modern static hosting the file is harder to get than every log analysis guide assumes.
Step 3: Analyze Trends - Not Just Snapshots
Raw numbers mean nothing without context. For every metric, compare against:
- Previous period (month-over-month or week-over-week)
- Same period last year (to account for seasonality)
- Your target or benchmark (are you on track?)
Highlight what changed significantly and explain why. “Organic traffic dropped 8% month-over-month” raises alarm. “Organic traffic dropped 8% MoM due to a seasonal dip consistent with last year’s pattern” provides clarity. For Search Console data, any day from 13 May 2026 to 27 April 2027 has a same-day-last-year inside a logging error that Google says affected impressions, CTR and average position but not clicks, so flag year-over-year impressions in that stretch and compare clicks as usual.
Step 4: Highlight Wins and Losses
Every report should have a clear “wins” section and a “needs attention” section. Be specific:
- Win: “Our guide on AI SEO strategy moved from position 14 to position 6, driving 340 additional organic sessions.”
- Needs attention: “Core Web Vitals failed on 12 pages after last week’s CMS update. LCP degraded by 1.2 seconds on affected pages.”
Step 5: Provide Actionable Recommendations
End every section with what to do next. An SEO report that just says “rankings dropped” without suggesting a response is incomplete. Tie every insight to an action.
Step 6: Write an Executive Summary
Place a brief summary at the top - three to five bullet points covering the most important takeaways. Many stakeholders will only read this section, so make it count.
Best Free and Paid SEO Reporting Tools
| Tool | Cost | Best For | Key Features |
|---|---|---|---|
| Google Search Console | Free | Search performance data | Impressions, clicks, CTR, position, index coverage, Core Web Vitals |
| Google Analytics 4 | Free | Traffic and conversion tracking | Organic sessions, user behavior, goals, attribution |
| Google Looker Studio | Free | Dashboard creation | Connects to GSC, GA4, Sheets; auto-refresh; shareable dashboards |
| Ahrefs | From $29/mo (Trial) or $129/mo (Lite) | Keyword and backlink analysis | Rank tracking, site audit, backlink monitoring, competitor analysis |
| Semrush | From $139/mo (Pro) | All-in-one SEO reporting | Position tracking, site audit, automated PDF reports, competitive intel |
| Screaming Frog | Free (500 URLs) / $259/yr | Technical crawl data | Crawl errors, redirects, duplicate content, structured data validation |
| SE Ranking | From $65/mo | Budget-friendly reporting | Rank tracking, site audit, white-label reports |
For most teams, the free stack of GSC + GA4 + Looker Studio covers 80% of what you need. Add Ahrefs or Semrush when you need keyword tracking, backlink monitoring, or competitor data at scale.
SEO Report Template: What Sections to Include
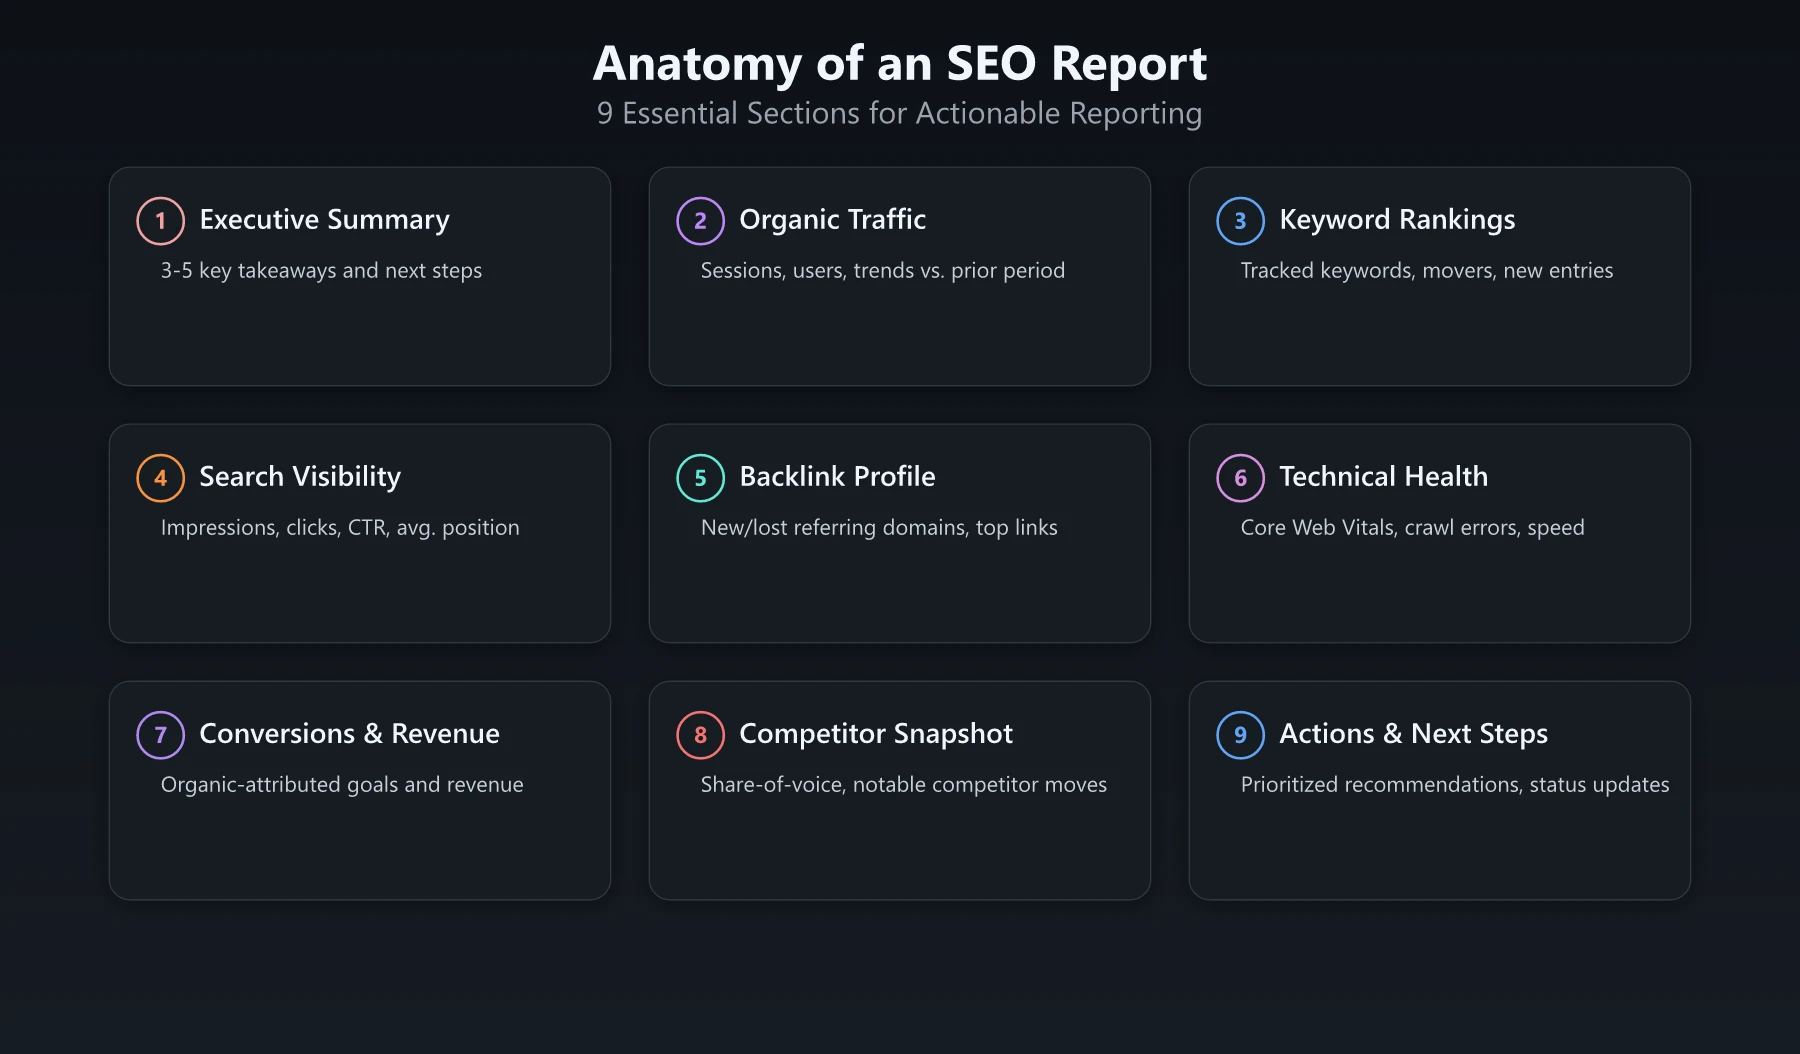
Here’s a practical template you can adapt for monthly reporting:
1. Executive Summary
Three to five bullet points covering the biggest wins, losses, and recommended next steps.
2. Organic Traffic Overview
- Sessions vs. previous month and year-over-year
- Top landing pages by organic traffic
- New vs. returning users
3. Keyword Rankings
- Movement of tracked keywords (grouped by priority)
- New keywords entering top 10 / top 3
- Keywords that dropped and potential causes
4. Search Visibility
- Total impressions and clicks from GSC
- Average CTR and position
- Top queries by clicks and impressions
5. Backlink Profile
- New and lost referring domains
- Top new links acquired
- Toxic or spammy links identified
Record the rel attribute next to each new referring domain, because the attribute a syndication platform stamps on your link back decides how much of that link Google is willing to count, and nofollow has been a hint rather than a directive since March 2020.
6. Technical Health
- Core Web Vitals status
- Crawl errors and index coverage changes
- Any site speed regressions
7. Conversions and Revenue
- Organic-attributed conversions
- Revenue or lead value from organic traffic
- Conversion rate changes
8. Competitor Snapshot
- Share-of-voice comparison
- Notable competitor moves (new content, new links)
9. Actions and Next Steps
- Prioritized list of recommended actions
- Status update on last month’s action items
One number worth adding to any report built on Search Console: clicks per position band. The band table shows whether ranking gains are converting on your property or stalling short of the top three.
SEO Report Example: A Filled-In Monthly Report
An SEO report example is the template above with real numbers dropped into it. The one below is mine: Google Search Console data for swapbiswas.com covering the 16 months that ended on 31 August 2026, pulled with the free stack from the tools table. Read as a result rather than a template demo, the same export is what a Domain Rating 13 site earned with no links built to it.
Executive Summary Example
- Organic impressions reached 164,000 over the period. Clicks reached 186, a site-wide CTR of 0.11%.
- 63% of those impressions came from queries where the site ranked at position 21 or worse.
- Queries that ranked in positions 1-3 earned a 6.98% CTR. Queries in positions 4-10 earned 0.048%.
- One cluster of 52 queries about SEO reporting produced 29,394 impressions and zero clicks.
- The page answering that cluster - this one - averages position 44.5 and has earned a single click on 34,303 impressions.
Query Performance Table
These are 11 of the 52 queries in that cluster, ordered by impressions. This table is the part of an SEO report that changes what anyone does next.
| Query | Impressions | Clicks | Avg. position |
|---|---|---|---|
| seo reporting | 6,297 | 0 | 55.7 |
| seo report | 5,613 | 0 | 38.3 |
| report seo | 3,625 | 0 | 57.7 |
| seo reports | 3,616 | 0 | 54.7 |
| what is an seo report | 2,044 | 0 | 21.4 |
| basic seo report | 1,144 | 0 | 22.9 |
| what is seo reporting | 1,068 | 0 | 8.0 |
| search engine optimization report | 792 | 0 | 43.2 |
| what is a seo report | 633 | 0 | 39.0 |
| google seo report | 390 | 0 | 51.5 |
| seo report summary | 297 | 0 | 37.6 |
The split in that table is the finding. The page holds position 8 for the definition question and sits between 38 and 58 for every head term, which tells me Google has filed it as a page that defines a phrase rather than a page that produces a report. Impressions keep accumulating on queries the page will not be seated for, and impressions with no clicks behind them are not progress.
Actions the Report Produced
- Give the head term what it asks for. What Google seats for “seo report” is mostly report generators and worked client reports, so a page that only defines the phrase has no route onto that first page. The section you are reading is the response.
- Watch “what is seo reporting” at position 8 and leave the rest of the cluster alone. It is the only query in the table close enough to the 6.98% band for a title or intro change to pay for itself.
- Stop counting cluster impressions as a win. 29,394 impressions at an average position of 44 measures how often a page was printed, not how often it was chosen.
- Re-measure the same table in 90 days on the same date window and read the position column first. If Search Console is not set up yet, checking your SEO ranking covers the free ways to pull position data.
One bullet list, one query table and four decisions is a complete basic SEO report. Pulling it took about twenty minutes, and it named the next quarter of work.
Common SEO Reporting Mistakes
Reporting metrics without context. Saying “we rank #4 for target keyword” means nothing if you were #3 last month and #15 the month before. Always show the trajectory.
Including too many metrics. A 20-page SEO report full of every available data point isn’t thorough - it’s unreadable. Focus on the metrics that connect to business outcomes. If a metric doesn’t help the reader make a decision, cut it.
Ignoring the “so what?” Every data point should be followed by an interpretation. Don’t just present charts - explain what they mean and what action they suggest.
Reporting only on vanity metrics. Impressions and rankings feel good, but conversions and revenue pay the bills. Make sure your SEO report connects traffic to business outcomes.
Setting the wrong reporting frequency. Weekly reports create noise for executive stakeholders. Quarterly reports are too slow for active campaigns. Match the frequency to the audience and the pace of work.
Not comparing year-over-year. Month-over-month comparisons miss seasonality entirely. If your organic traffic drops 15% from December to January, that might be completely normal. Year-over-year data tells the real story.
Conclusion: Build an SEO Report That Drives Action
Understanding what is an SEO report is just the starting point. The real value comes from building a report that your team actually reads and acts on.
Start with the free tools - Google Search Console, GA4, and Looker Studio. Use the template above to structure your first report. Focus on the metrics that matter to your specific audience, and always tie data to decisions.
The best SEO report isn’t the longest or the prettiest. It’s the one that answers “What should we do next?” with clarity and evidence. With organic search driving over half of all website traffic and Google rolling out multiple core updates every year, a business that reports consistently catches a ranking change while it is still small. Build that report consistently, and SEO stops being a black box and starts being a measurable growth channel.
Frequently Asked Questions
What is an SEO report?
An SEO report is a document that tracks and summarizes your website's search engine optimization performance, including metrics like organic traffic, keyword rankings, backlinks, and technical health.
How often should you create an SEO report?
Most teams create SEO reports monthly, with weekly check-ins for high-priority campaigns. Quarterly reports work well for executive stakeholders who need a broader view of trends.
What tools can I use to create an SEO report?
Google Search Console and Google Analytics are free essentials. For more advanced reports, tools like Ahrefs, Semrush, and Screaming Frog provide deeper keyword, backlink, and technical audit data.
What does an SEO report look like?
A filled SEO report is a short executive summary, a query table showing impressions, clicks and average position for every term, and a list of actions. The worked example in this guide uses 16 months of Google Search Console data for this site.
What goes in a basic SEO report?
A basic SEO report covers total clicks and impressions for the period, a query table with average position for each term, and the decisions those numbers support. Everything else is optional detail for a specific audience.