Striking Distance Keywords: The Payoff Curve, Measured
Striking distance keywords promise easy page-1 wins. I banded 1,000 Search Console queries by position and measured what moving from page 2 actually paid.
| What the striking distance playbook promises | What my Search Console export returned |
|---|---|
| Queries at positions 11-20 already rank, so a small push moves them onto page 1 | 234 queries averaging 11-20 earned 27,339 impressions and 6 clicks in 16 months |
| Page 1 is where the clicks are, so the promotion pays for itself | 149 queries already averaging 4-10 earned 8,561 impressions and 4 clicks |
| The work is cheap, because the page already exists | Closing the gap between those two bands is worth a single-digit number of extra clicks over the same 16 months |
Both columns describe the same 1,000 queries, pulled from Google Search Console for swapbiswas.com between 1 May 2025 and 31 August 2026. The left column is the standard framing of the method. The right column is what happened when I ran the arithmetic on my own property instead of assuming it. That property is a Domain Rating 13 site with no deliberate link building behind it, and I measured the full 16-month result of SEO without link building separately.
The targeting half of the playbook is sound. Filtering Search Console to a position band is a fast, honest way to find queries you already rank for. The half that fails without announcing itself is the payoff estimate underneath, which assumes that arriving on page 1 converts impressions into traffic at published-curve rates. Striking distance keywords are a targeting rule, and the payoff attached to them has to be measured separately. That measurement takes about twenty minutes, which is cheap against a quarter spent optimizing the wrong band.
What Striking Distance Keywords Are
Striking distance keywords are queries a site already ranks for, sitting close enough to page 1 that a modest improvement could move them into positions that earn clicks. The usual definition is positions 11-20, which maps onto page 2 of a ten-result SERP. Nobody standardized the boundary. My own earlier writeup on building an AI-assisted SEO workflow defines the band as positions 5-15, and I have seen both wider and narrower cuts used elsewhere. Whichever you pick, record it, because your band totals move with it.
The instruction attached to it is short: pull the query export, filter to the band, sort by impressions, and work those pages first. That instruction is fine. What sits underneath it, unstated, is a forecast: that a query moving from 15 to 8 starts earning clicks at the rate a global CTR curve says position 8 earns.
That forecast is the part worth checking, because it is the only part that decides whether a quarter of optimization work was worth doing.
How to Find Striking Distance Keywords in Google Search Console
This takes about ten minutes on any verified property.
- Open Performance and then Search results. Set the date range to the longest window available, which is 16 months.
- Switch on all four metric tiles: Clicks, Impressions, CTR and Average position. Average position is off by default, and it is the column this whole method depends on.
- Select the Queries tab under the chart and sort by Impressions descending.
- Use Export at the top right to pull the table into Sheets, Excel or CSV.
- In the export, filter to rows whose average position falls inside your band. For the standard definition, that is 11 through 20.
What comes back is your candidate list. Before you act on it, three properties of the data change how you should read it.
Average position is an average, not a rank. Google’s own definition is that the position value is “the topmost position occupied by a link to your property or page in search results, averaged across all queries in which your property appeared” (Search Console Help). A query showing 15.0 might sit at 15 consistently, or it might sit at 8 half the time and 22 the other half. Those two queries need completely different work, and the export cannot tell them apart.
An impression is a low bar. The same page defines it this way: “In general, an impression is counted whenever an item appears in the current page of results, whether or not the item is scrolled into view, as long as the user need not click to see more results.” Impressions accumulate from people who never looked.
The query table is not your whole site. My export returned exactly 1,000 query rows, carrying 103,338 impressions and 49 clicks. The same property’s site-wide totals for that window are 164,564 impressions and 186 clicks. So the query table covers 63% of my impressions but only 26% of my clicks. Whatever you conclude from a query export is a conclusion about the queries in the export. The page-level cut of the same export is a separate picture again: banding all 147 URLs by position to build a keyword map turned up 23 that have never earned a single impression, and no query row can point at them.
If you are still setting up the underlying measurement, how to check your SEO ranking properly covers the difference between Search Console position data and third-party rank trackers, which disagree more than most people expect. One correction before you read it: that post tells you the jump from position 11 into the top 10 is the single biggest traffic gain available, and prices the 4-10 band off the FirstPageSage curve. This post is me measuring both claims on my own property and getting a different answer.
The CTR Band Worksheet
The worksheet is four steps, and it produces one number: the click-through rate gap between the band you are in and the band you are trying to reach. That gap is the entire business case for striking distance work on your property.
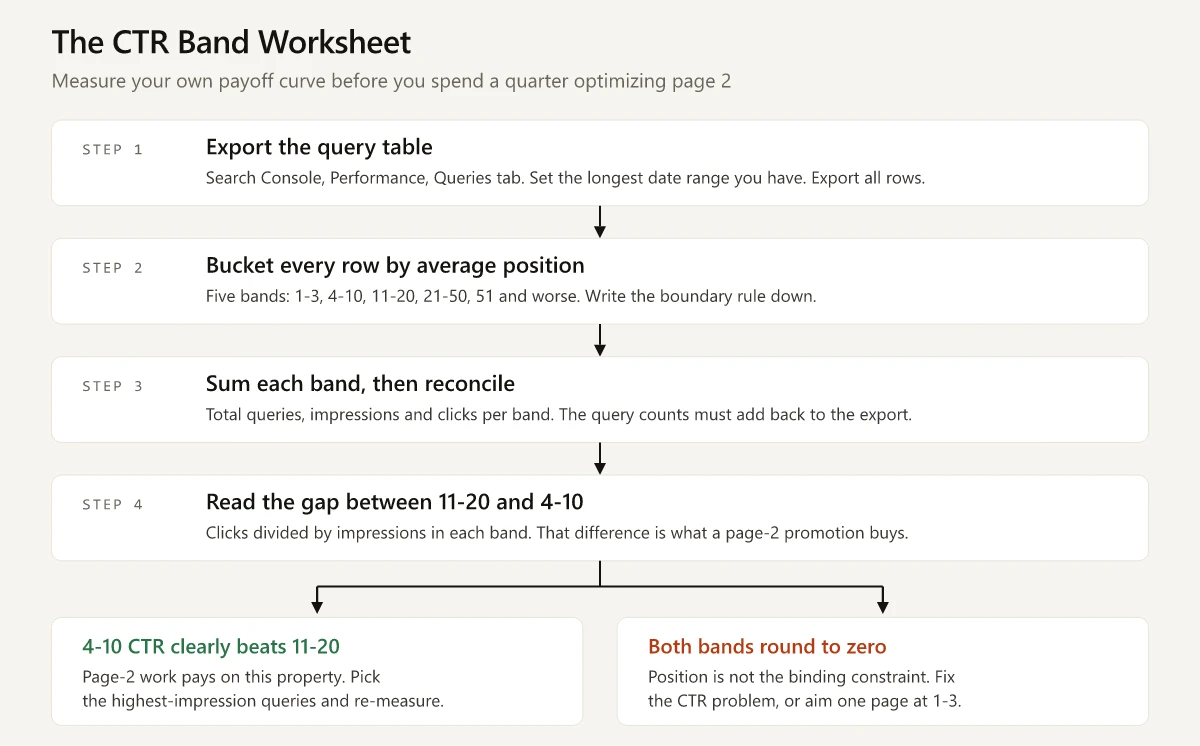
The shape of the output is a five-row table with one row per position band:
| Average position | Queries | Impressions | Clicks | CTR |
|---|---|---|---|---|
| 1-3 | ||||
| 4-10 | ||||
| 11-20 | ||||
| 21-50 | ||||
| 51 and worse | ||||
| Total |
Three details decide whether the result is trustworthy.
Write the boundary rule down before you bucket. A row at 10.6 goes in one band under “round to nearest” and a different band under “floor”. It sounds pedantic until you compare two cuts of the same export. The band table below uses “average position less than or equal to the top of the band”, so a row at 10.4 lands in 11-20. Re-cutting the same 1,000 rows by rounding to the nearest integer instead moves the 4-10 band to 158 queries and 9,521 impressions, and drops the headline number at the end of this post from about seven clicks to about five.
Reconcile the query counts. When I first banded this export in my internal measurement notes, the five bands added to 935 queries out of the 1,000 rows I had pulled, carrying 99,737 of the 103,338 impressions and 47 of the 49 clicks. So 65 rows, 3,601 impressions and 2 clicks went missing from the totals with nothing flagging it. I never reconstructed which rows they were; the likeliest culprit is fractional positions falling between two integer bands and being picked up by neither. The corrected cut adds to exactly 1,000. If your band rows do not sum back to your export row count, the CTR you are about to compute is wrong.
Compute CTR from your own sums, not from the CTR column in the export. Search Console’s CTR is per row. You need clicks divided by impressions for the whole band, which is impression-weighted and will not match the average of the row-level percentages.
The Band Table: 1,000 Queries, 103,338 Impressions, 49 Clicks
Here is the completed worksheet for swapbiswas.com, taken from property sc-domain:swapbiswas.com over the window 1 May 2025 to 31 August 2026, a span of 488 days, search type Web, top 1,000 query rows.
| Average position | Queries | Impressions | Clicks | Band CTR |
|---|---|---|---|---|
| 1-3 | 12 | 516 | 36 | 6.98% |
| 4-10 | 149 | 8,561 | 4 | 0.047% |
| 11-20 | 234 | 27,339 | 6 | 0.022% |
| 21-50 | 390 | 37,368 | 2 | 0.005% |
| 51 and worse | 215 | 29,554 | 1 | 0.003% |
| Total | 1,000 | 103,338 | 49 | 0.047% |
Add the two middle rows and the striking distance band on this property is 383 queries and 35,900 impressions, which together produced 10 clicks across 16 months.
The 1-3 row looks like the exception until you open it. One branded query, my own name, accounts for 289 of that band’s 516 impressions and 35 of its 36 clicks. Strip it out and the remaining eleven top-three queries earned 1 click from 227 impressions, a CTR of 0.44%.
Individual rows make the pattern concrete:
what is seo reportingaverages position 7.99, with 1,068 impressions and 0 clicksproduct launch email sequence best practicesaverages 4.09, with 211 impressions and 0 clicks/blog/sales-enablement-checklist/averages 5.85 across all its queries, with 832 impressions and 0 clicks
Each of those already sits inside the band the playbook is trying to reach, and each one earns nothing there.
The Arithmetic: Moving Page 2 to Page 1 Was Worth Seven Clicks
Take the 11-20 row and ask what it would have earned at the CTR the 4-10 band actually delivered.
- 4-10 band CTR, measured: 4 clicks / 8,561 impressions = 0.0467%
- 11-20 band impressions: 27,339
- 27,339 x 0.000467 = 12.8 clicks, against the 6 clicks that band earned
Promoting the entire page-2 inventory onto page 1, all 234 queries, would have produced about seven extra clicks over 488 days. Roughly one additional click every ten weeks.
Three things about that seven. It rests on a four-click numerator, so it is fragile: recompute with 3 clicks in the 4-10 band and the answer is 3.6 extra clicks, recompute with 5 and it is 10.0. Read the direction as the finding and the decimal as noise.
It also swaps one band’s CTR onto another band’s impressions while the two bands hold different queries. My 4-10 band is a glossary: seventeen of its twenty highest-impression rows are definitional lookups about GA4 cross-network traffic and the ChatGPT acronym. My 11-20 band is commercial: the 38 rows containing the word “audit” carry 12,038 of its 27,339 impressions, led by seo audit cost at 2,201. Two mixes that different have no reason to convert alike, so the projection holds only while composition holds, and composition does not hold here.
And it treats all 27,339 of the 11-20 impressions as page-2 exposure. A query averaging 15 across 488 days may have spent whole weeks on page 1, and to that extent some of those impressions and some of the 6 clicks the band already earned were page-1 results a promotion has already bought. That pushes the true figure below seven.
Running the same sum against the 1-3 band CTR gives 27,339 x 0.0698 = 1,908 clicks, which is the number a naive projection would put in a slide. That number belongs in a slide and nowhere else, and the band table above says why: 97% of the clicks in that band come from one branded navigational query. A CTR earned by people searching my name does not transfer to seo audit pricing.
There is a genuine counter-case, though it comes from the Pages tab of the same property and not from the query table. My homepage sits at average position 4.35 and converted 920 impressions into 58 clicks, a CTR of 6.3%. Two caveats travel with it: that 4.35 is an impression-weighted average across every query the homepage appears for, including branded ones sitting at position 2, and those 58 clicks fall outside the four the 4-10 query band recorded. So it makes composition the leading candidate for why the 4-10 band reads flat, and a candidate is what it stays.
For the broader question of which content metrics are worth tracking at all, measuring SaaS content marketing covers the attribution side of the same problem.
Do Striking Distance Keywords Work?
The targeting rule works, and the payoff assumption attached to it needs testing per property. Filtering Search Console to positions 11-20 does reliably return queries you already rank for, which beats a keyword tool’s guesses as a starting point. What it does not tell you is whether arriving on page 1 will earn anything, and on this property the measured answer was close to nothing.
This is one site: 137 indexed pages, one 488-day window, traffic weighted toward the United States, and a query mix that skews to definitional SEO and analytics questions. The number that matters is your own, which is why the worksheet is the deliverable here and my band table is only a worked example of it.
Three Things That Could Explain a Flat 4-10 Band
I can measure the effect. I cannot yet isolate the cause, and picking one and presenting it as settled would be dishonest.
The band may never have been the band. Nothing in the export says when a query held its average. A query reading 8 could have spent forty weeks at 25 and eight weeks at 3, collecting its impressions in the forty and its handful of clicks in the eight. That produces exactly the shape I measured, a large impression count against almost no clicks, while page 1 performed normally every week it was actually reached. Weekly position history on the top queries in the band would separate the two readings, and I have not pulled it.
AI Overviews may be absorbing the clicks. Advanced Web Ranking’s Google Organic CTR Study, which has published a monthly dataset since September 2015 and was last updated in July 2026, states that when an AI Overview appears, “the reduction at position 1 has typically been on the order of half, though the exact size varies by month, device, and search intent” (Advanced Web Ranking). Seventeen of the twenty highest-impression queries in my 4-10 band are definitional lookups, which is the kind of query I would expect to draw an Overview. That expectation is mine: the Advanced Web Ranking study measures what an Overview does to CTR once it appears and says nothing about which queries trigger one. So this is a hypothesis consistent with what I measured, and some distance from a demonstrated cause. If it applies to your site too, optimizing for AI Overviews and the wider AEO versus SEO comparison are the more useful work.
Geography splits the result in a way I cannot explain. This figure comes from the property’s country breakdown, which is site-wide and therefore a different universe from the query table above: United States traffic at 110,088 impressions and 53 clicks, a CTR of 0.048%, against India at 7,850 impressions and 91 clicks, a CTR of 1.159%. A 24x gap. Those 144 clicks sit outside the 49 in the band table, and I have no country-by-page breakdown, so I cannot even confirm the two countries are landing on the same pages. I have recorded it as unresolved in my measurement notes; every explanation I can construct is a story I have not tested.
Until one of those is settled, the correct read on my own band table is narrow: on this property, in this window, moving a query from page 2 to the bottom of page 1 did not buy traffic.
Published CTR Curves and What They Actually Say
The payoff assumption borrows its authority from CTR-by-position studies. I checked four that get cited regularly before writing any comparison, and what they carry is worth publishing on its own.
| Source | What it publishes | What it does not settle |
|---|---|---|
| Search Console Help | Definitions of clicks, impressions, CTR and position, including that position is averaged across queries | Defines the metrics. The expected rate has to come from your own property |
| Advanced Web Ranking CTR study | Average organic CTR for each of the top 20 positions from Search Console data across millions of keywords, updated monthly since September 2015, last updated July 2026 | The per-position values sit in an interactive chart you filter by device, intent and month, so there is no fixed figure to quote |
| FirstPageSage | 39.8% at position 1, 7.2% at position 4, 1.6% at position 10, updated 28 May 2025 | The page describes the method as “a meta-analysis, combining research on click-through rates”, so its curve is a synthesis of several other studies |
| seoClarity | Around 750 million impressions and 32 million clicks across nearly 12 million keywords, comparing April 2024 with April 2025, published July 2025 | The page publishes year-over-year change by position and puts the CTR levels themselves behind a download |
One figure I dropped entirely: the 28.5% CTR at position 1 reported in a SISTRIX analysis of over 80 million keywords. The article carries a publication date of 14 July 2020 and a modified date of 7 July 2025, and I could not find a stated collection window for the underlying data anywhere on the page. I will not benchmark a 2026 SERP against a six-year-old number with an unknown measurement window.
Set the FirstPageSage meta-analysis against my band table and the size of the mismatch is the finding: their curve puts position 4 at 7.2% and position 10 at 1.6%, and my measured 4-10 band came in at 0.047%. Those are not like-for-like. Theirs is a per-position blend across many sites and query types; mine is one impression-weighted band on one small site dominated by informational queries. That is the point. Neither number predicts the other, so borrowing theirs to forecast mine was always going to be wrong.
When Striking Distance Work Is Worth Doing
The band table converts a vague judgment into a rule you can apply in an afternoon.
| What your band table shows | What to do |
|---|---|
| 4-10 CTR is clearly above 11-20 CTR | Work the striking distance keywords. The destination band pays, so the promotion is worth funding |
| Both bands round to near zero, but the 1-3 band is healthy and non-branded | Stop optimizing for page 1. Pick one or two queries with a credible path to the top three and go deep on those instead |
| Both bands near zero and the 1-3 band is branded only | Position is not your binding constraint. Work on titles, snippets and SERP-feature presence before you chase rank |
| A query already sits at 4-6 with real impressions and zero clicks | Rank is done. The problem is the snippet, the intent match, or a SERP feature answering above you |
| The SERP for the query shows an AI Overview | Check the citation set before committing. Ranking 8th under an Overview and ranking 8th without one are different outcomes |
| Position swings widely inside one query’s history | Fix stability first. Averaged data is hiding whichever weeks the page actually performed |
Two of those rows have nothing to do with position. A query at position 5 with 800 impressions and no clicks has a presentation problem, and internal linking will not touch it. A band table that shows nothing paying anywhere except a branded query is telling you the site has a presentation problem, or an intent-match problem, before it has a position problem.
Search Console remains the right tool for this. It tells you which of those six rows you are in, and the striking distance filter gets you into that data quickly. Running the filter without running the band table is what turns a diagnostic into an assumption. If you want the full sequence this sits inside, my SEO audit checklist works the same property from crawlability down to internal links, and the band table belongs in its content step. The reporting side of it is covered in what an SEO report should actually contain.
Run the Worksheet Before You Run the Play
My next quarter goes to two things the band table pointed at: a small number of queries with a plausible route to positions 1-3, and the presentation problem sitting underneath a 0.047% click-through rate at positions 4-10. Promoting 234 page-2 queries for a single-digit click return did not make the list.
Your table will say something different. It might well say the striking distance keywords on your property are exactly where the return is, and if it does, you will have a defensible number to put behind the request for time. Export the query table, band it, and read the gap.
Frequently Asked Questions
What are striking distance keywords?
Striking distance keywords are queries a site already ranks for, close enough to page 1 that a small improvement could move them into positions that earn clicks. The band is usually defined as positions 11-20, though the boundary varies: my own earlier writeup on AI-assisted SEO uses 5-15.
How do I find striking distance keywords in Google Search Console?
Open Performance, switch on Average position alongside Clicks, Impressions and CTR, open the Queries tab, and export the table. Then filter the export to rows whose average position falls inside your chosen band and sort by impressions.
Do striking distance keywords work?
The targeting rule works: it reliably surfaces queries you already rank for. The payoff depends on what page 1 pays on your specific property. On my site, in the top 1,000 query rows of a 16-month Search Console export, 149 queries averaging positions 4-10 earned 8,561 impressions and 4 clicks, so promotion into that band bought very little.
What position range counts as striking distance?
There is no standard range. Positions 11-20 is the common definition because it maps to page 2 of the classic ten-result SERP. Whichever boundary you pick, write it down, because your band totals change with it.
Why do my page 2 keywords get impressions but no clicks?
Google counts an impression whenever your link appears in the results a searcher sees, so impressions accumulate without any click intent behind them. AI Overviews, featured snippets and other SERP features can also answer the query before anyone reaches an organic result.