What Is a Good Number of Impressions on LinkedIn?
A good number of impressions on LinkedIn is the 75th percentile for your follower band: 528 under 1,000 followers, 1,178 at 1,000-5,000. Eight benchmarks compared.
Look up what is a good number of impressions on LinkedIn for an account of about 1,000 people, and the published benchmarks run from 300 impressions per post to 5,000. OutX calls 300 to 500 good at 500 to 1,000 connections. ContentRadar calls 1,000 to 5,000 solid for an average user with “a few hundred to a few thousand connections”, and Bluecast says a good range “might be 2,000 to 5,000” for anyone with 1,000+ connections.
That is a gap of more than 16 times for the same account, and none of those three sources publishes the data behind its number. Most of the eight sources compared below come from companies that sell LinkedIn tools; I post on LinkedIn several times a week and sell none.
Each source picks a denominator (connections or followers), a statistic (a typical post or a better-than-typical one), a post format and an account type. Most print the denominator next to the figure and several name the account type or format, but only MagicPost ties the word good to a stated percentile and publishes the sample behind it. That makes MagicPost’s table the outside benchmark I would anchor on, and your own last 90 days of posts the comparison no outside benchmark can give you.
What Is a Good Number of Impressions on LinkedIn?
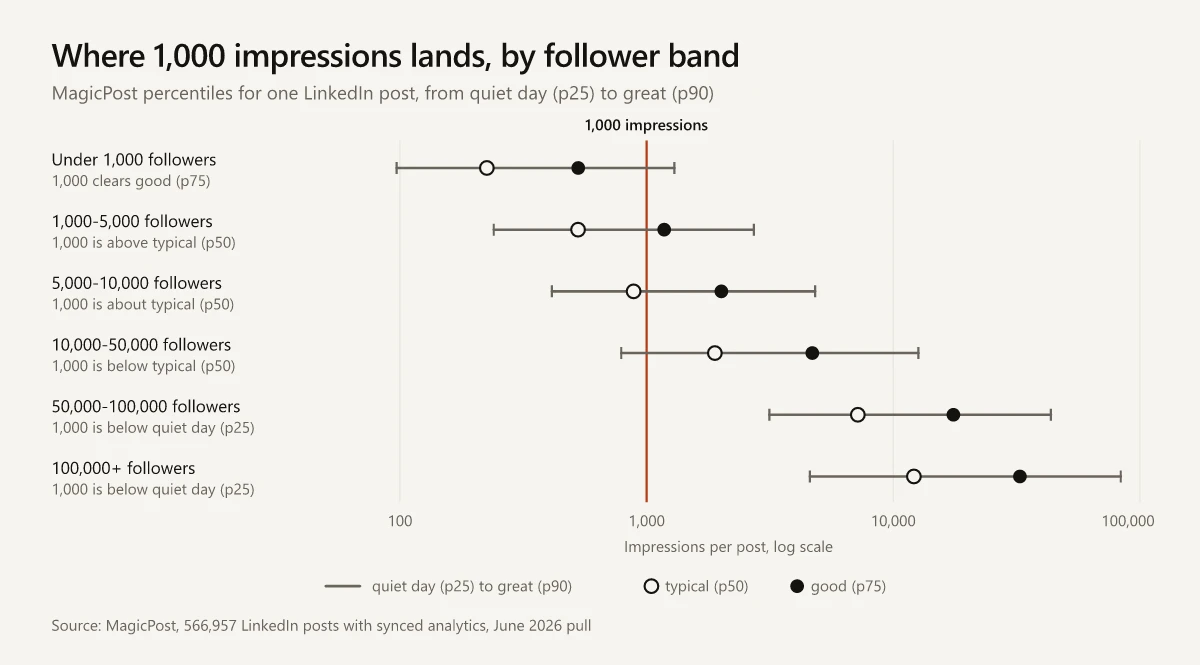
A good number of impressions on LinkedIn is about the 75th percentile for your follower band: 528 per post under 1,000 followers, 1,178 at 1,000 to 5,000, 2,008 at 5,000 to 10,000 and 4,693 at 10,000 to 50,000, in MagicPost’s percentile table (six follower bands drawn from 566,957 posts with synced analytics).
| Followers | Quiet day (p25) | Typical (p50) | Good (p75) | Great (p90) | Posts measured |
|---|---|---|---|---|---|
| Under 1,000 | 97 | 225 | 528 | 1,296 | 65,852 |
| 1,000-5,000 | 240 | 527 | 1,178 | 2,720 | 219,796 |
| 5,000-10,000 | 413 | 885 | 2,008 | 4,819 | 101,378 |
| 10,000-50,000 | 789 | 1,890 | 4,693 | 12,641 | 137,892 |
| 50,000-100,000 | 3,144 | 7,178 | 17,521 | 43,546 | 13,544 |
| 100,000+ | 4,590 | 12,111 | 32,587 | 83,541 | 10,258 |
MagicPost built the table from posts with synced analytics published over the previous 12 months, excluded reshares and deleted posts, and reports percentiles rather than averages so one viral post cannot inflate a band. The figures come from its June 2026 pull, and the six band rows add up to 548,720 of the 566,957 posts.
The sample is MagicPost’s own synced data, which means accounts that use a LinkedIn posting tool, not everyone on LinkedIn. The table also does not separate personal profiles from Company Pages.
For Company Pages, Socialinsider’s disclosed-sample averages are in the Company Page section below.
Is 1,000 Impressions on LinkedIn Good?
Under 1,000 followers, yes: 1,000 impressions clears the good line (528) in MagicPost’s table above. At 1,000 to 5,000 followers it beats the typical post (527) but falls short of good (1,178), at 5,000 to 10,000 it is about typical, above 10,000 it falls below the median, and past 50,000 it lands under the quiet-day line.
| Followers | 1,000 impressions | 2,000 impressions | 5,000 impressions |
|---|---|---|---|
| Under 1,000 | Between good (528) and great (1,296) | Above great (1,296) | Above great (1,296) |
| 1,000-5,000 | Between typical (527) and good (1,178) | Between good (1,178) and great (2,720) | Above great (2,720) |
| 5,000-10,000 | Just above typical (885) | Just under good (2,008) | Above great (4,819) |
| 10,000-50,000 | Between quiet day (789) and typical (1,890) | Just above typical (1,890) | Between good (4,693) and great (12,641) |
| 50,000-100,000 | Under quiet day (3,144) | Under quiet day (3,144) | Between quiet day (3,144) and typical (7,178) |
| 100,000+ | Under quiet day (4,590) | Under quiet day (4,590) | Between quiet day (4,590) and typical (12,111) |
Why LinkedIn Impression Benchmarks Disagree
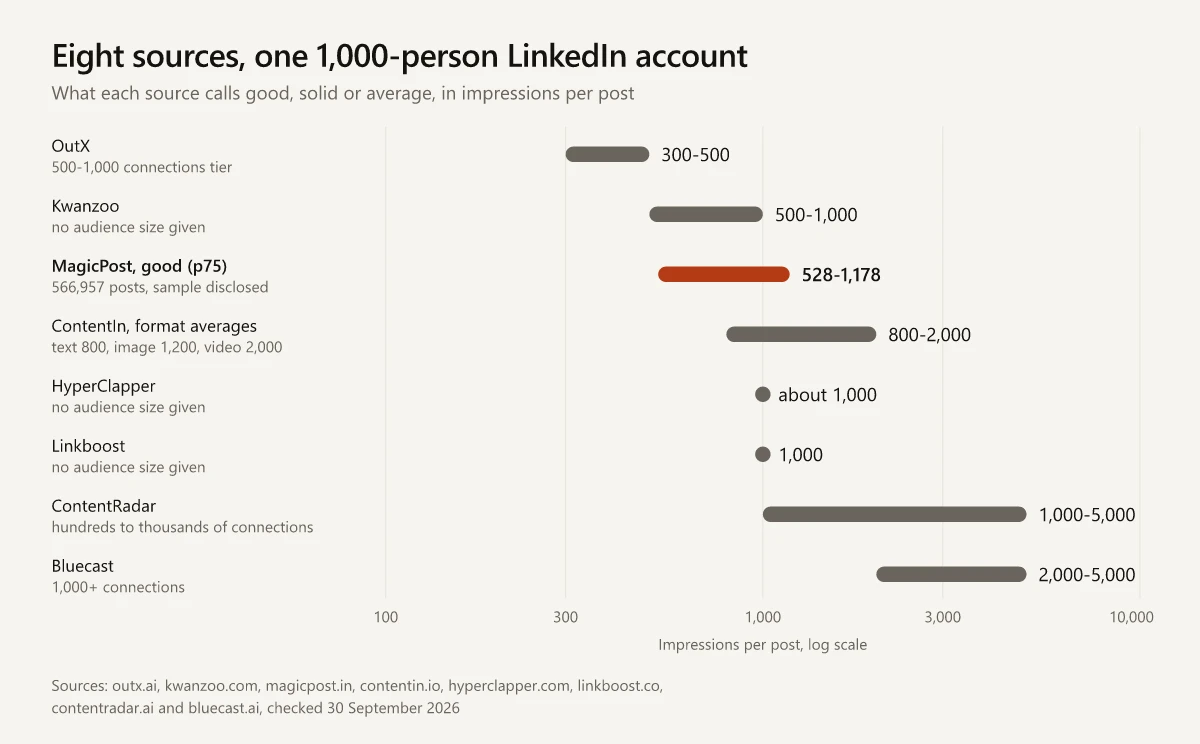
These are the eight benchmark sources I checked on 30 September 2026, with the figure each gives for an account of about 1,000 people, what it divides by and whether it shows its data:
| Source, last update | ”Good” for about 1,000 people | Denominator | Label used | Sample disclosed |
|---|---|---|---|---|
| OutX, 14 May 2026 | 300-500 (500-1,000 connections) or 500-1,500 (1,000-3,000 connections) in its tier list; 1,000-5,000 in its FAQ | 500-1,000 or 1,000-3,000 connections (tier list); under 5K followers (FAQ) | “considered good”; FAQ: “solid” | No. Credited to “Hootsuite and various LinkedIn analytics studies”, and the Hootsuite link goes to OutX’s own Hootsuite-alternatives article |
| Kwanzoo, no visible date (page schema: modified 16 Dec 2025) | 500-1,000 | None stated | ”Good for most professionals” | No |
| ContentIn, 2 Aug 2026 | About 800 text, 1,200 image, 2,000 video | Per 1,000 followers | ”average” | No. Attributed to “our benchmark data (mid-2026)“ |
| ContentRadar, no visible date (page metadata: modified 4 Nov 2025) | 1,000-5,000 | ”a few hundred to a few thousand connections" | "solid” | No |
| Bluecast, 12 Mar 2025 | 2,000-5,000 | 1,000+ connections | ”a good range” | No |
| HyperClapper, no visible date (page schema: modified 11 Jul 2026) | Around 1,000 | None stated | ”can be considered good” | No |
| Linkboost, 18 Nov 2024 | 1,000 | None stated | ”a solid starting point” | No |
| MagicPost, 5 Jun 2026 | 528-1,178 | Followers, the bands either side of 1,000 | ”Good (p75)“ | Yes, 566,957 posts |
The check is the one I ran on MQL to SQL conversion benchmarks: find what each number divides by before comparing it with anything.
Connections and Followers Are Different Denominators
LinkedIn’s audience analytics defines Total followers as “your total follower count, including connections and non-connection followers” (LinkedIn Help on audience analytics). ContentRadar, Bluecast and OutX’s tier list key their bands to connections, while ContentIn, MagicPost and OutX’s own FAQ key theirs to followers, so one person has two different sizes depending on the table.
Take an account with 800 connections and 1,300 followers:
| Source | Where the account lands | Good figure there |
|---|---|---|
| OutX, tier list | 500-1,000 connections | 300-500, “considered good” |
| OutX, FAQ | Under 5K followers | 1,000-5,000, “solid” |
| MagicPost | 1,000-5,000 followers | 1,178, the band’s p75 |
MagicPost’s good line is more than twice the top of OutX’s tier-list range, and OutX alone puts the same account’s good or solid post anywhere from 300 to 5,000, depending on which of its own denominators you read.
Good Means a Different Statistic in Each Source
MagicPost ties each label to a percentile: typical is the median post for the band, good is the 75th percentile and great is the 90th. In its table the good line sits 2.2 to 2.7 times the median in every band, and the great line sits 5.2 to 6.9 times the median. Those ratios pool posts from many accounts in each band, so they describe the band as a whole and not any one account in it.
A source that calls a typical post good and a source that saves the word for a top-decile post will differ by 5 to 7 times for the same follower band before any other choice is made. Kwanzoo, ContentRadar and Bluecast use “good” or “solid” without saying which part of the distribution they mean, and OutX says only that it evaluates impressions “in Average” before listing the ranges it calls good.
ContentIn publishes two benchmarks in one article. Its follower-share bands call 10-30% of followers “healthy, typical organic distribution” and anything above 30% a post “traveling beyond your immediate network”.
Its format averages of 800 to 2,000 impressions per 1,000 followers equal 80% to 200% of followers, so by its own bands the average text post is already traveling beyond the network. At 1,000 followers the two benchmarks give 100-300 and 800-2,000, and the ranges never touch.
OutX adds two more figures for an account this size. Its conclusion sets 100-300 impressions as the “baseline expectation” at 500-1,000 connections, and its FAQ says “If you have 1,000 followers, expect 50-100 impressions per post without viral engagement.” Both describe a typical post rather than a good or solid one; counted in, they would stretch the spread at the top of this post down to 50.
Format Moves the Median by Almost 3x
| Format | MagicPost median impressions | Posts measured | ContentIn, per 1,000 followers |
|---|---|---|---|
| Poll | 1,154 | 6,209 | Not given |
| Carousel | 1,031 | 34,694 | Not given |
| Image | 823 | 347,689 | About 1,200 |
| Video | 708 | 43,078 | About 2,000 |
| Text only | 664 | 98,279 | About 800 |
| Link or article | 414 | 32,897 | Not given |
The two columns use different denominators, so compare the order, not the values. ContentIn puts video first. In MagicPost’s measured medians video sits fourth of six, below image, and a poll’s median is 2.8 times a link post’s.
MagicPost’s separate link study puts a post with an attached link preview at 414 median impressions against 795 for a post without one, and a post with the URL typed into its body at 858. MagicPost files link-preview posts under its article format, so the “Link or article” row in the table above, at the same 414 median, describes link posts and says nothing about LinkedIn’s long-form articles, which I compare with newsletter editions in my check of how LinkedIn articles and newsletters are served.
Stack a statistic choice on a format choice and the gaps can multiply. In MagicPost’s 1,000-5,000 band a great post is 5.2 times the typical one, and 5.2 times the 2.8 poll-to-link gap is about 14, so one dataset read two ways could produce most of a 16-fold gap. None of OutX, ContentRadar or Bluecast ties its figure to a percentile or a format, so this arithmetic shows how a gap that size can arise without showing that it explains theirs.
Company Page Benchmarks Spread Just as Wide
For Company Pages, the disclosed-sample reference is Socialinsider’s 2026 LinkedIn benchmarks, built on 1.3 million posts from 16,645 LinkedIn business Pages. Its table gives average impressions per post for seven formats at each Page size. The spread across formats:
| Page followers | Lowest format average | Highest format average |
|---|---|---|
| 1,000-5,000 | 235 (link) | 525 (native document) |
| 5,000-10,000 | 70 (link) | 1,210 (multi-image) |
| 10,000-50,000 | 340 (link) | 1,850 (multi-image) |
| 50,000-100,000 | 50 (link) | 4,845 (poll) |
| 100,000-1M | 1,180 (native document) | 9,797 (poll) |
These are averages, not medians, from Pages active between January 2024 and December 2025, and Socialinsider notes that the study presents 2025 values as 2026.
Socialinsider’s text says multi-image posts lead on impressions for Pages up to 50,000 followers, but its own table puts native documents just ahead at 1,000 to 5,000 (525 vs 490). Multi-image does lead at 5,000 to 50,000 (1,210 and 1,850), and polls lead above 50,000 (4,845 and 9,797).
For a Page under 1,000 followers, OutX calls 300 to 600 good and Kwanzoo calls 1,000 to 2,000 “decent”, while ContentRadar, naming no follower count, puts 100 to 1,000 as “the average for small to mid-sized company pages”. Kwanzoo’s floor for that small Page is about two to four times what Pages with 1,000 to 5,000 followers averaged in Socialinsider’s table (235 to 525).
LinkedIn Impressions vs Members Reached
Impressions count every time LinkedIn displayed your post; members reached counts the distinct members and Pages that saw it, without repeats. LinkedIn uses those two labels in member and Page analytics, while Campaign Manager keeps impressions and calls the distinct count reach, as of September 2026:
| Your post analytics | Page content analytics | Campaign Manager | |
|---|---|---|---|
| Every display | Impressions: “Number of times your post was shown on LinkedIn” | Impressions: “The number of times your post was shown on LinkedIn” | Impressions: “Number of times your ad was displayed” |
| Counting rule stated | None in the post analytics help | ”at least 50 percent on the screen for 300 milliseconds or more, or when it’s clicked” | Sponsored Content: 50% in view for 1 second on desktop; on mobile, “50% or 300dp” (density-independent pixels) in view for 300 milliseconds |
| Distinct people | Members reached: “distinct members and Pages that saw your post” | Members reached, which “does not include repeat displays” | Reach: “The number of unique member accounts with at least one impression” |
| Displays per person | Not shown, so divide impressions by members reached | Not shown, same division | Average frequency, reported |
| Precision | ”estimates and may not be precise" | "an estimate and may not be precise” | Reach and frequency are “modeled, not exact numbers” |
Sources: LinkedIn Help on post analytics, Page content analytics, Campaign Manager performance metrics and Campaign Manager delivery metrics.
A post with 3,000 impressions and 2,000 members reached was shown 1.5 times per viewer on average. Campaign Manager names the same ratio average frequency, “the average number of impressions shown to each member account that received at least one impression”.
Do LinkedIn Impressions Include Your Own Views?
Yes. LinkedIn’s post analytics help says: “Your own views, social engagements, link engagements, saves, and sends are counted towards the analytics of your content.” That is firmer than ContentIn’s line that your own refreshes or clicks “may register”.
On a post with a few hundred impressions, your own views are part of the number you are judging.
Boosted Posts Report Differently in Each Tool
If you boost a post, LinkedIn’s post analytics help says you “may see ad-only breakdowns” for analytics such as discovery and social engagement. For Pages, content analytics include only boosted posts that appear in the feed, while Campaign Manager also counts other ads and offsite views, so the two tools can show different numbers for one post. Leave boosted posts out of any organic median.
How to Check Your LinkedIn Impressions in Native Analytics
Every step below uses LinkedIn’s own analytics, as documented in LinkedIn Help in September 2026.
- Read your total followers. On desktop, click the Me icon, then View Profile, then Show all in the Analytics section to open Analytics & tools (LinkedIn Help on Analytics & tools). Creator analytics sit on this page too, and LinkedIn Help says all members have access to them. LinkedIn removed the creator mode toggle some guides still point to in 2024, so there is no setting to turn on first. Use Total followers from Audience analytics to find your band, not your connection count.
- List the last 90 days of posts with their impressions. Click the Me icon, then Posts & Activity under Manage; each post shows its impressions count in the lower-left corner (LinkedIn Help on viewing post analytics). Leave out reposts, boosted posts and anything from the last few days, which is still collecting impressions, then take the median.
- Find your follower band and place your median on it. Total followers picks the MagicPost row; compare your median with that row’s typical (p50) and good (p75) columns. An illustrative account with 2,400 followers and a 600-impression median sits in the 1,000-5,000 row, above its typical post (527) and below its good line (1,178). Divide the median by total followers only when you compare against a share-of-followers benchmark: 600 is 25% of 2,400, inside ContentIn’s 10-30% “healthy” band.
- Open View analytics on your best and worst posts. Note the Out of network share, which LinkedIn defines as the “Percentage of impressions from members who don’t follow or aren’t connected to you”, and divide impressions by members reached. If the best post’s Out of network share is well above the worst post’s, more of its impressions came from people outside your followers and connections. If impressions per member reached is well above 1, the same people saw it more than once, so compare members reached between the two posts as well as impressions.
- Judge each new post against your own spread. Sort your last 90 days of posts by impressions and note the 75th percentile, the value three quarters of them sit under; with 20 posts, that is about the 5th from the top. A post above it is good for your account in the sense MagicPost uses for good (p75), measured on your own posts.
On a Company Page, the Content engagement section of Page content analytics lists impressions for each post, so the same median and 75th percentile work there.
Export what you want to keep. Combined post analytics exports to an .XLSX file for a date range from the past 7 days up to the past 365 days (LinkedIn Help on combined post analytics), and LinkedIn keeps each kind of post data for a different period:
| Post data | Available for |
|---|---|
| Impressions and engagement counts on posts other than video and articles | 1,000 days |
| Members reached (posts other than video and articles) | 400 days |
| Demographic breakdowns (posts other than video and articles) | 180 days |
| Video performance and viewer demographics | 365 or 180 days (LinkedIn’s two post analytics help articles disagree) |
| Article and newsletter analytics, including viewer demographics | Two years |
What to Report Next to Your LinkedIn Impressions
LinkedIn’s post analytics help lists these metrics next to impressions for each post:
| Metric in post analytics | Why report it |
|---|---|
| Reactions, Comments, Reposts | Whether viewers responded |
| Saves, Sends on LinkedIn | Whether they kept the post or passed it on |
| Profile viewers from this post, Followers gained from this post | Whether the post grew the account |
| Visits to links in this post | Whether it sent traffic |
For a reactions benchmark, MagicPost measured the median like rate (likes divided by impressions) falling from 2.38% under 1,000 followers to 1.55% at 100,000+.
Members counted under Profile viewers from this post are also part of your profile views, which include visits from any route and run on a different window from search appearances, so I would compare each of those two numbers with its own earlier weeks and never divide profile views by search appearances. Your profile has separate impression numbers, which LinkedIn’s help lists as Total impressions and Impressions per section in the Profile engagement block under Search Appearances.
Tag any link with a UTM from a campaign naming convention so the visits land under a campaign you can read. I keep each LinkedIn post’s draft, UTM and image prompt together in one markdown file, so a click can be traced back to the post that earned it.
On a scorecard, impressions belong with the product marketing metrics that count as inputs, next to the outcomes leadership funds. If your posts are the distribution arm of a thought leadership program, the test from publishing thought leadership content applies: views show the distribution worked, and citations show the argument did. Track which posts get quoted, linked or forwarded into a sales thread.
What Is a Good Number of Impressions on LinkedIn for Your Account?
A good number of impressions on LinkedIn for your account clears two 75th percentiles: MagicPost’s for your follower band, picked by total followers rather than connections, and your own last 90 days of posts.
The published figures for a good post run from 300 to 5,000 for the same account, and MagicPost’s is the only source behind them that shows its data.
Pull your last 90 days of posts and write down your median and your 75th percentile.
Frequently Asked Questions
Is 1,000 impressions on LinkedIn good?
It depends on your follower count. In MagicPost's percentile table (six follower bands drawn from 566,957 posts with synced analytics), 1,000 impressions falls between the good line (528) and the great line (1,296) under 1,000 followers, between the typical post (527) and the good line (1,178) at 1,000 to 5,000 followers, and below the median (1,890) at 10,000 to 50,000.
What is the average number of LinkedIn impressions per post?
The median post in MagicPost's June 2026 data gets 225 impressions under 1,000 followers, 527 at 1,000 to 5,000, 885 at 5,000 to 10,000 and 1,890 at 10,000 to 50,000. A median is a safer guide than an average here, because a handful of viral posts can pull an average far above the typical post.
What is the difference between impressions and members reached on LinkedIn?
Impressions count every time LinkedIn showed your post. Members reached counts the distinct members and Pages that saw it, without repeat views. Dividing impressions by members reached gives the average number of times each viewer saw the post, which Campaign Manager reports for ads as average frequency.
Do LinkedIn impressions include your own views?
Yes. LinkedIn's post analytics help states that your own views, social engagements, link engagements, saves and sends are counted towards the analytics of your content.
What is a good number of impressions for a LinkedIn company page?
Start with the Page's own last 90 days of posts. For an outside benchmark, Socialinsider's 2026 LinkedIn benchmarks, built on 1.3 million posts from 16,645 business Pages active between January 2024 and December 2025, show Pages with 1,000 to 5,000 followers averaging 235 to 525 impressions per post depending on format, and Pages with 10,000 to 50,000 followers averaging 340 to 1,850.